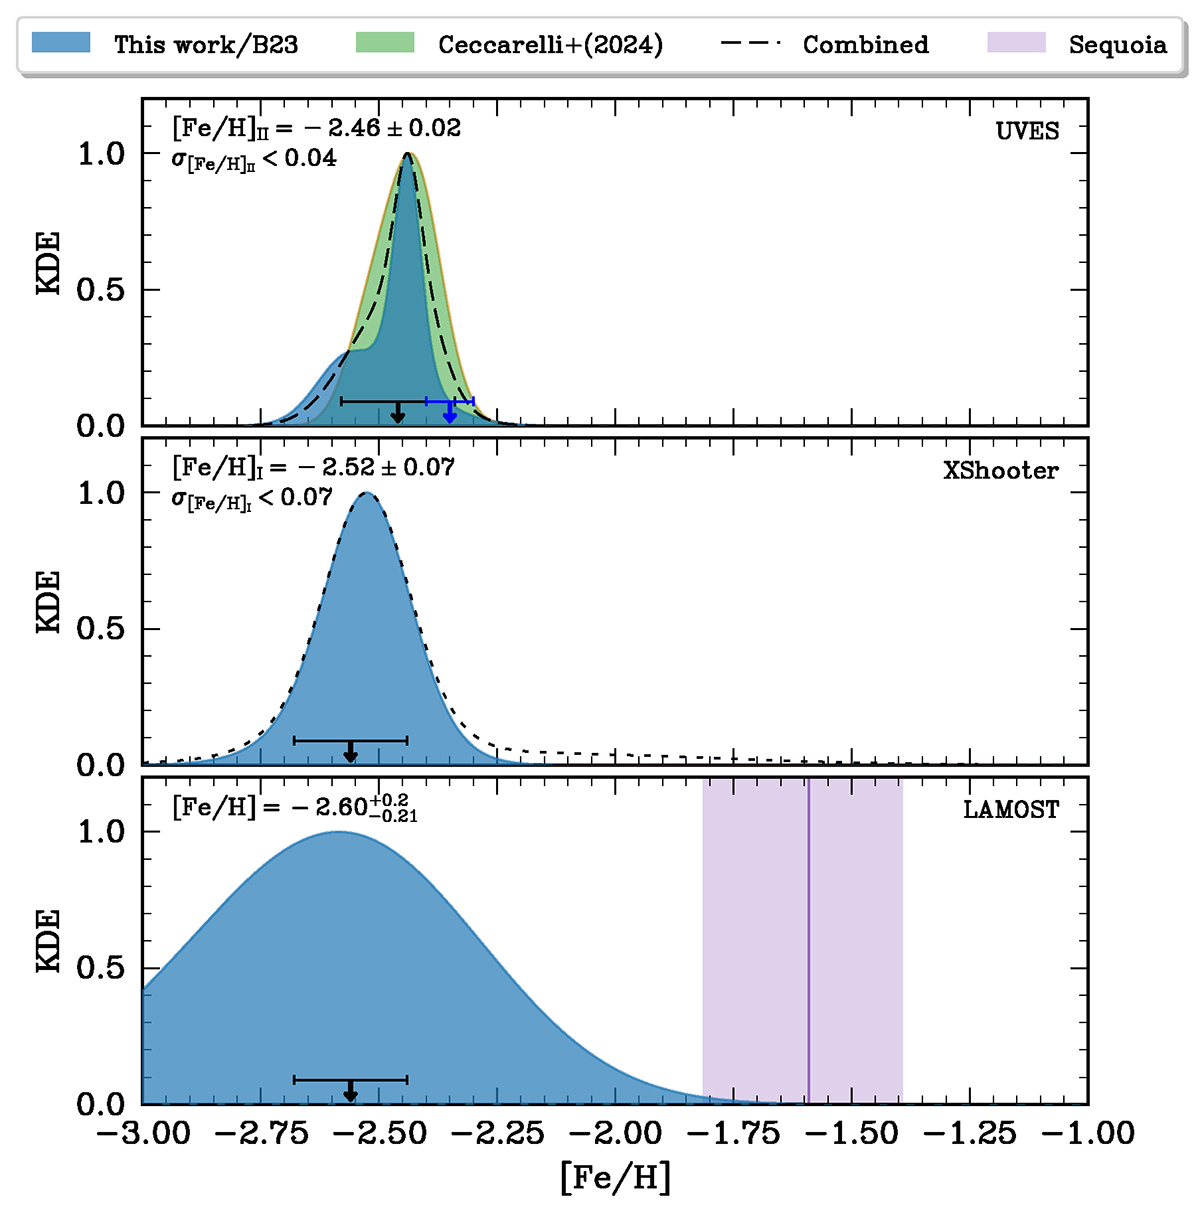
Fig. 4.
Download original image
Metallicity distribution for ED-2 based on UVES, X-Shooter, and LAMOST spectra in the top, middle, and bottom panels, respectively. The arrow and error bar show the Gaia BH3 companion’s metallicity and uncertainty, as inferred by Gaia Collaboration (2024), in the top panel, using Fe II lines and by our own analysis in blue (see also Table A.1). In the top left of each panel the best-fit metallicity and the upper bound on the metallicity dispersion are given. In the middle panel, the dashed distribution includes a star with large [Fe/H] uncertainties. In the bottom panel the 25%–75% quantiles for members of Sequoia (following the classification of Dodd et al. 2023) are shown as a shaded band using metallicity estimates from LAMOST.
Current usage metrics show cumulative count of Article Views (full-text article views including HTML views, PDF and ePub downloads, according to the available data) and Abstracts Views on Vision4Press platform.
Data correspond to usage on the plateform after 2015. The current usage metrics is available 48-96 hours after online publication and is updated daily on week days.
Initial download of the metrics may take a while.