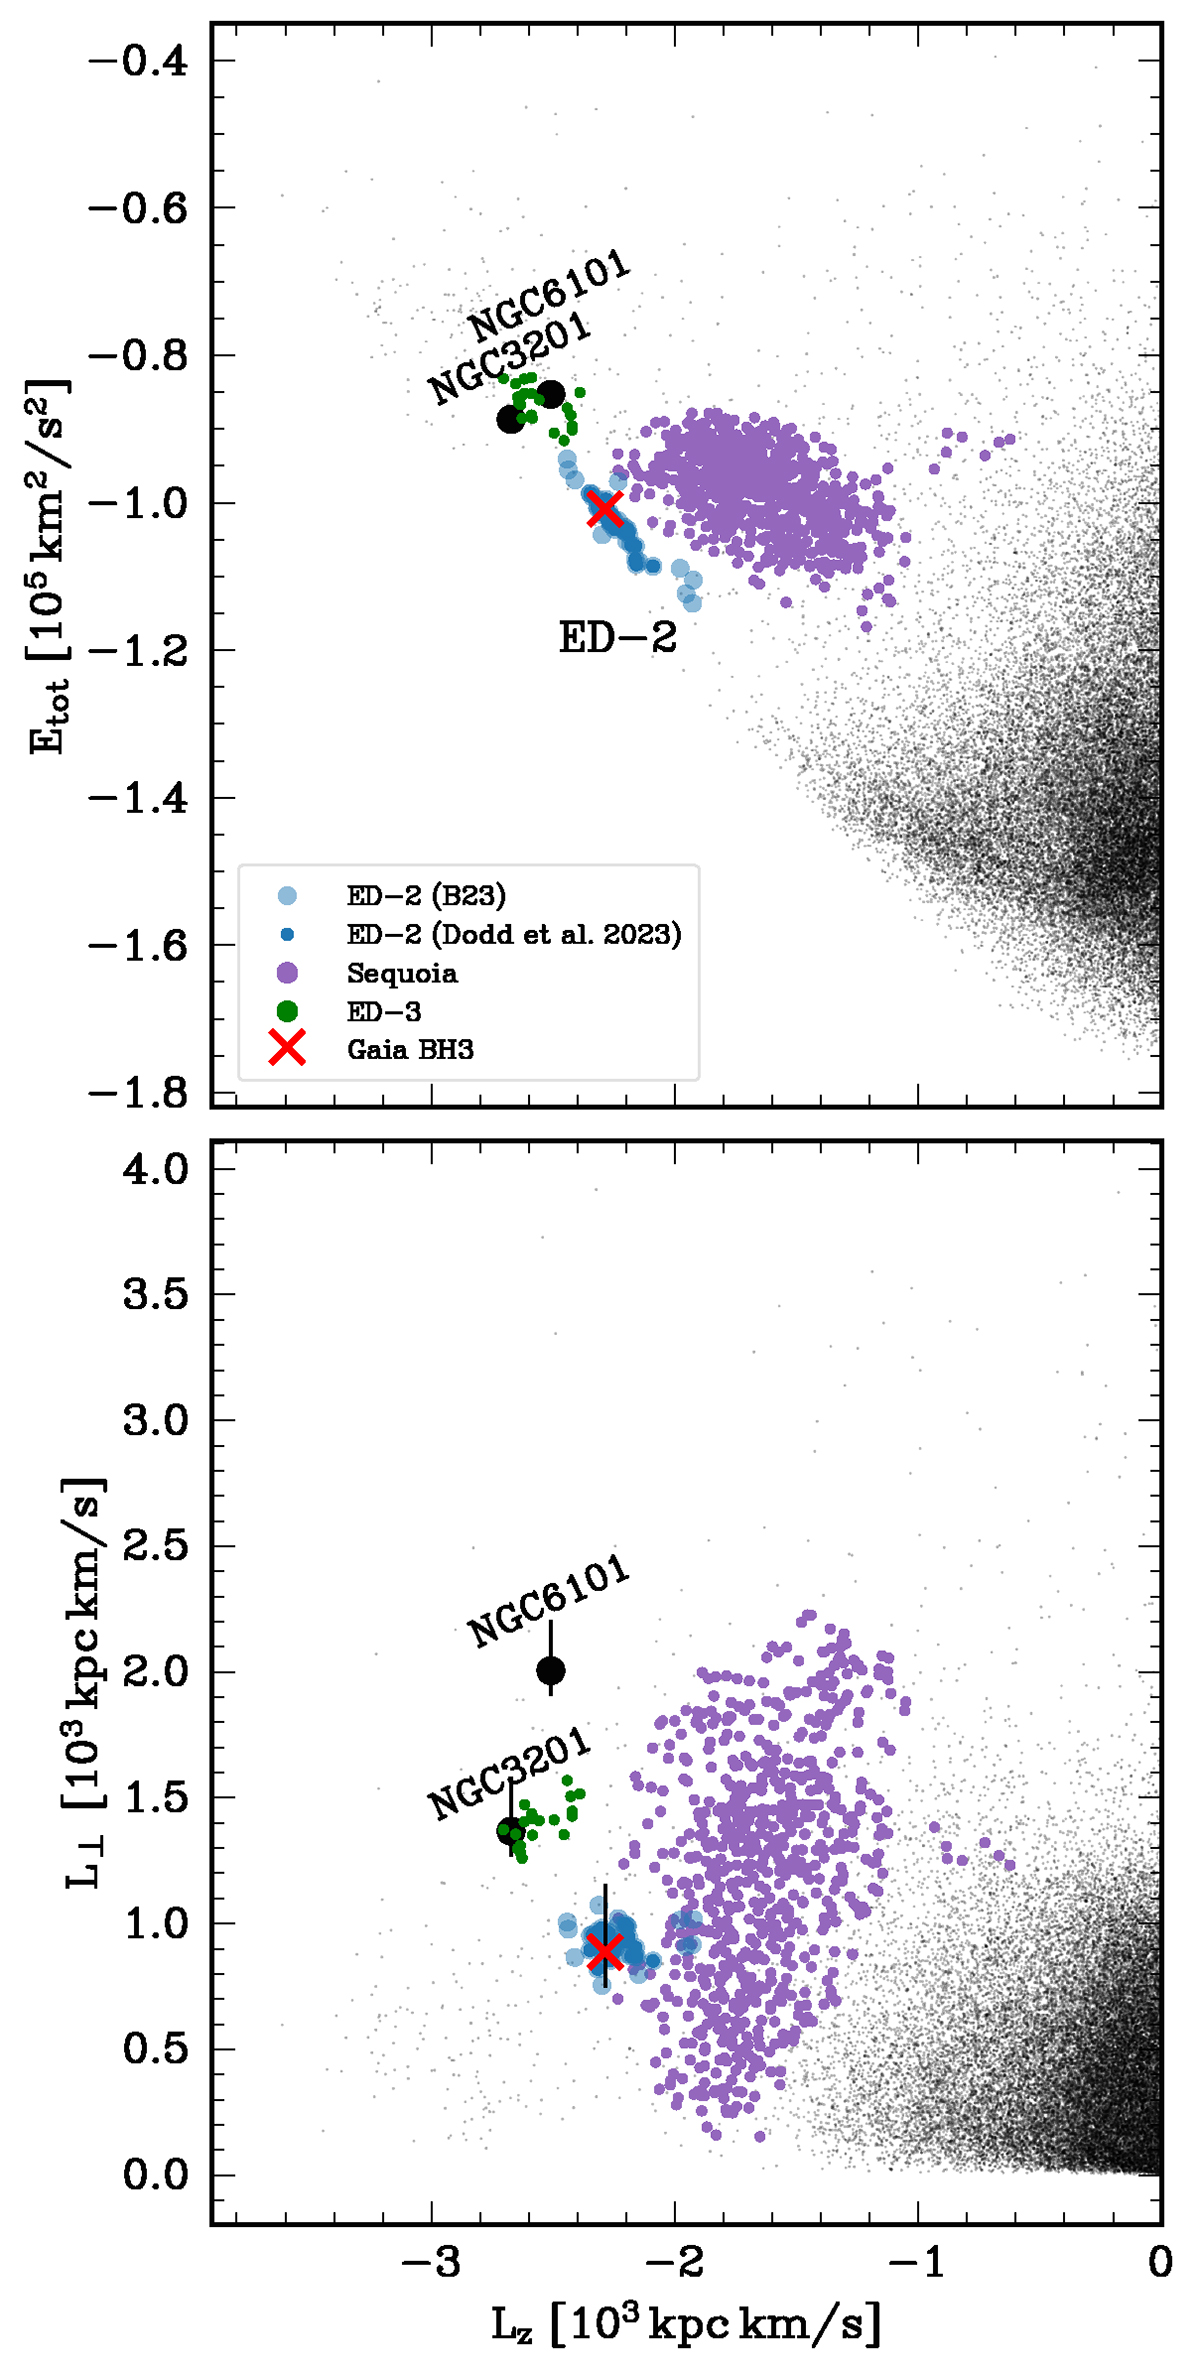
Fig. 2.
Download original image
Lz vs. Etot (top panel) and vs. L⊥ (bottom panel) showing ED-2 as blue and lighter blue circles, corresponding respectively to original members from Dodd et al. (2023) and to the extended sample (see B23 for details). Gaia BH3 is shown as a red cross. Members of ED-3 and Sequoia (as classified by Dodd et al. 2023) are also shown. The dark points in the background are from the Gaia DR3 6D sample within 3 kpc and RUWE < 1.4. We also show two retrograde GCs. The vertical error bars show the variation in L⊥ for ED-2 and the two GCs along their orbits.
Current usage metrics show cumulative count of Article Views (full-text article views including HTML views, PDF and ePub downloads, according to the available data) and Abstracts Views on Vision4Press platform.
Data correspond to usage on the plateform after 2015. The current usage metrics is available 48-96 hours after online publication and is updated daily on week days.
Initial download of the metrics may take a while.