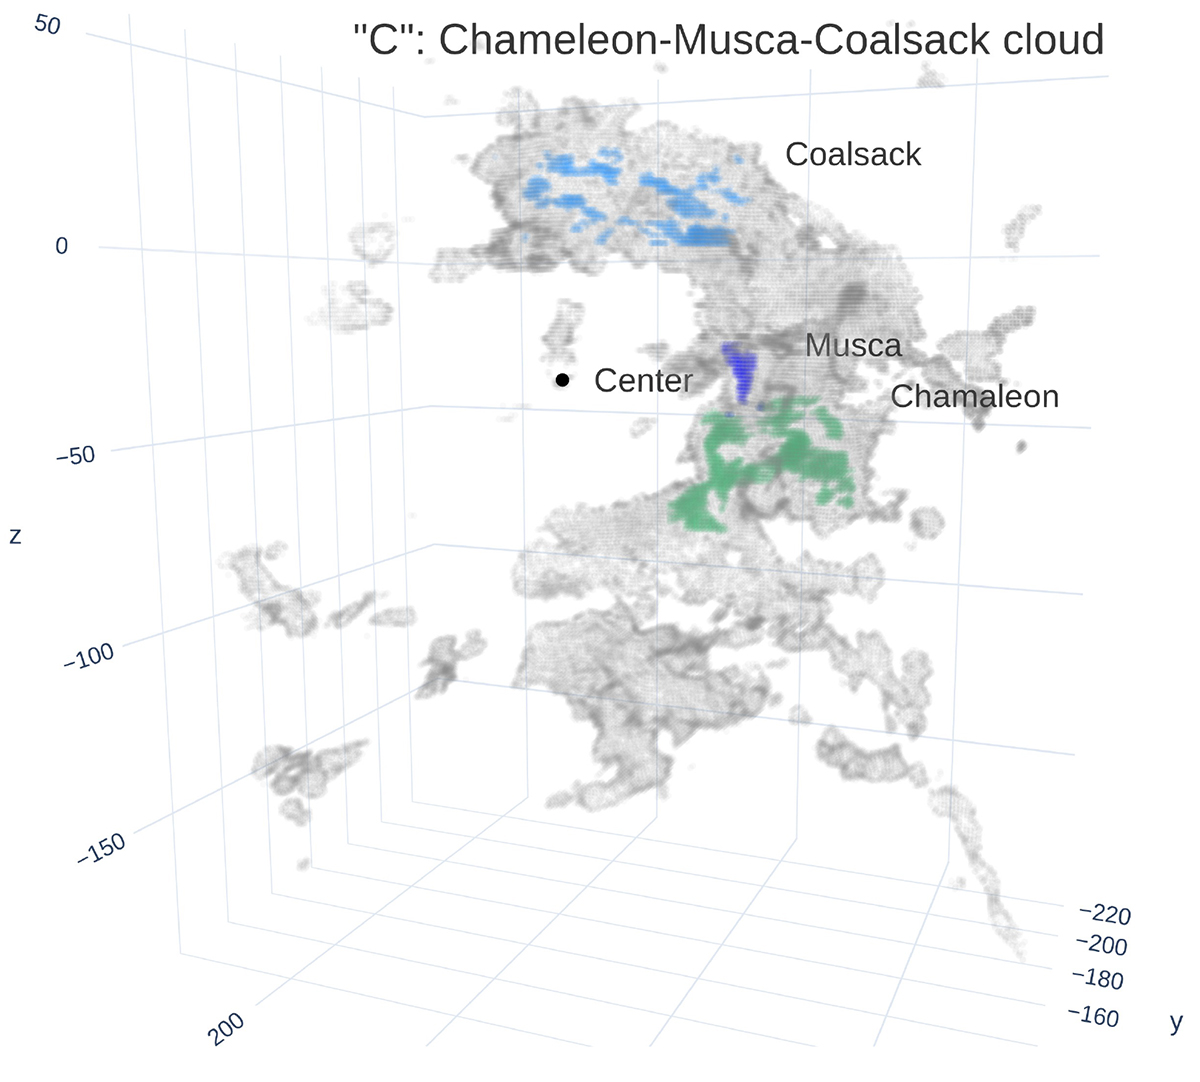
Fig. 2.
Download original image
3D view of the isodensity surface of the posterior mean of the 3D dust map of Edenhofer et al. (2024b) within the Cartesian selection given in Table 1, showing the C. High-density structures (nH ≥ 23.3 cm−3; the 10 000 highest-density points of a 1 pc Cartesian interpolation of the C) toward Chameleon are color-coded in green (290° ≤l ≤ 306° and −21° ≤b ≤ −12°), toward Musca in violet (300° ≤l ≤ 302.5° and −13° ≤b ≤ −7.25°), and toward Coalsack in blue (300° ≤l ≤ 318° and 0.5° ≤b ≤ 7.5°). An interactive version of this figure is available at https://faun.rc.fas.harvard.edu/gedenhofer/perm/C/C_Chameleon_Musca_Coalsack_cloud.html.
Current usage metrics show cumulative count of Article Views (full-text article views including HTML views, PDF and ePub downloads, according to the available data) and Abstracts Views on Vision4Press platform.
Data correspond to usage on the plateform after 2015. The current usage metrics is available 48-96 hours after online publication and is updated daily on week days.
Initial download of the metrics may take a while.