Fig. 5
Download original image
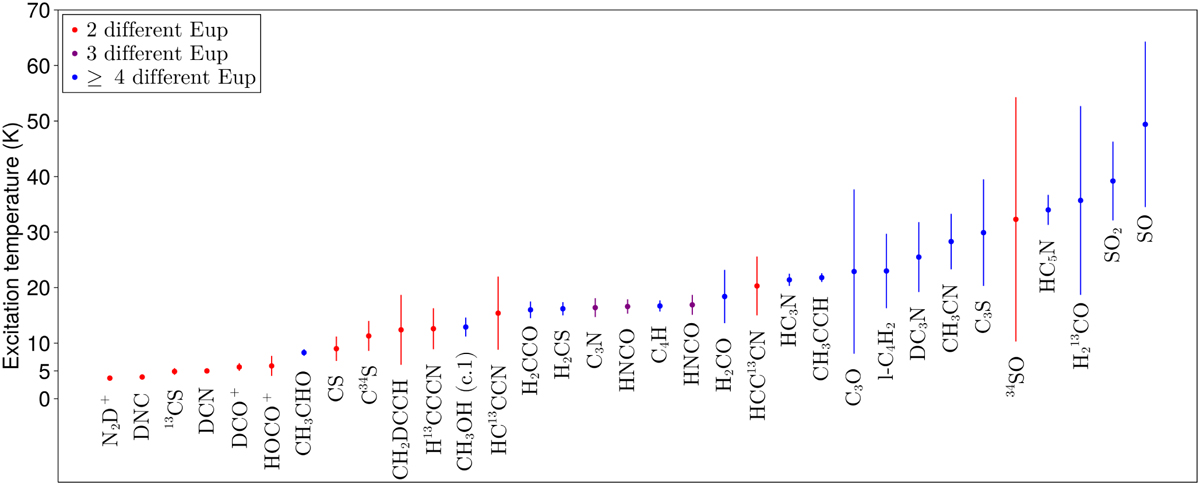
Excitation temperatures derived for each species with our LTE modeling, excluding OCS that has a very high excitation temperature (see Sect. 3.2.1). The species are sorted by increasing excitation temperatures. The colors represent the number of different Eup available to derive the excitation temperatures: 2 (red), 3 (purple), and ≥4 (blue). The vertical lines represent the error bars.
Current usage metrics show cumulative count of Article Views (full-text article views including HTML views, PDF and ePub downloads, according to the available data) and Abstracts Views on Vision4Press platform.
Data correspond to usage on the plateform after 2015. The current usage metrics is available 48-96 hours after online publication and is updated daily on week days.
Initial download of the metrics may take a while.