Fig. 2
Download original image
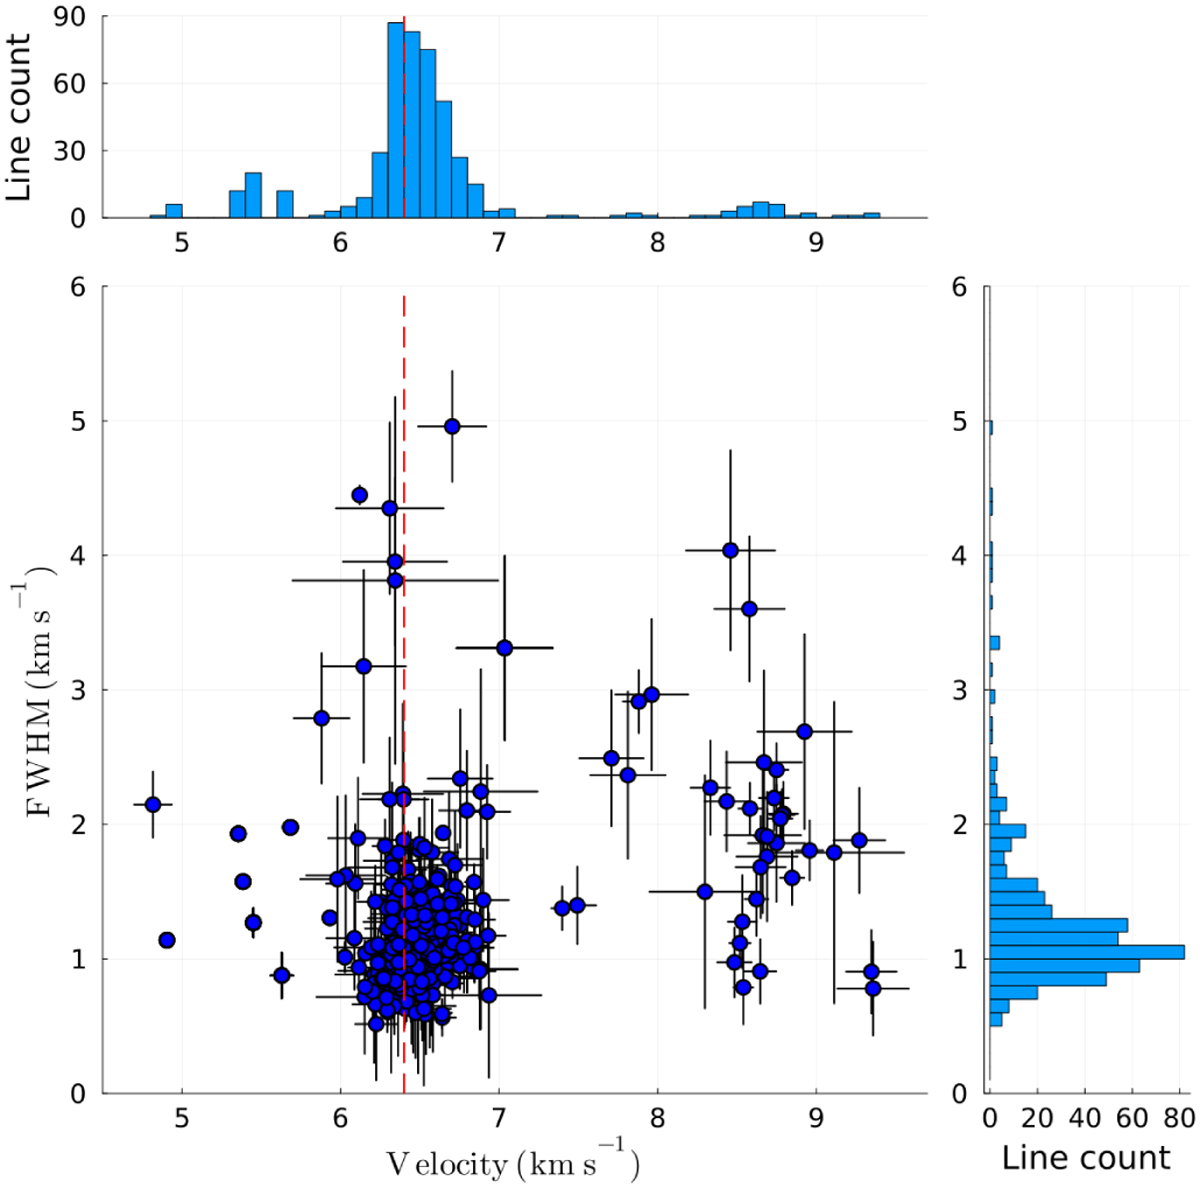
FWHM as a function of the Doppler shift velocity for all the detected lines, obtained through Gaussian fitting (bottom-left). The dashed red line indicates the envelope local standard of rest velocity of 6.4 km s−1. The top and right panels represent histograms of the line count for the Doppler shift velocity and the FWHM, respectively.
Current usage metrics show cumulative count of Article Views (full-text article views including HTML views, PDF and ePub downloads, according to the available data) and Abstracts Views on Vision4Press platform.
Data correspond to usage on the plateform after 2015. The current usage metrics is available 48-96 hours after online publication and is updated daily on week days.
Initial download of the metrics may take a while.