Fig. 6
Download original image
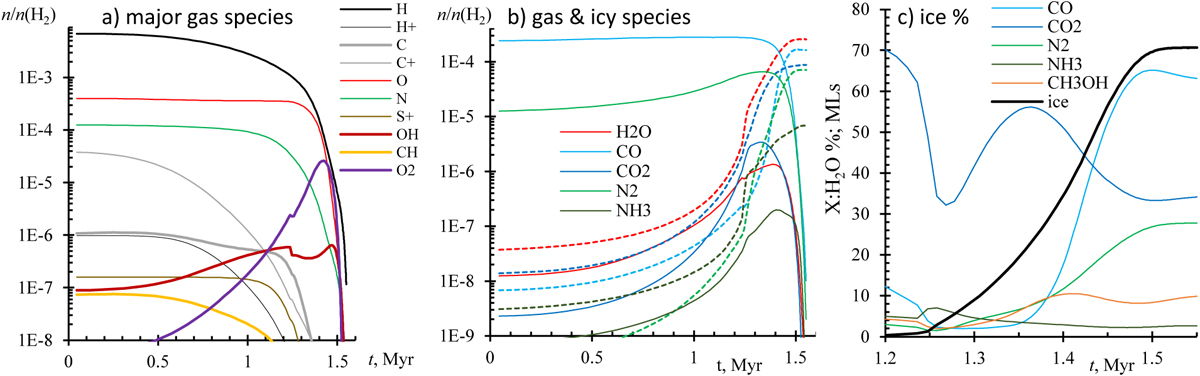
Overall chemical results for prestellar core Model full with variable ED and other features enabled. Panel a: abundance of the primary gaseous species relative to that of H2. Panel b: species that are abundant in ices; solid lines are for the gas phase, while dashed lines are for solid phase abundances, relative to H2. Panel c: percentage, relative to H2O ice, for major icy molecules. The black curve is the average ice thickness ![]() on grains.
on grains.
Current usage metrics show cumulative count of Article Views (full-text article views including HTML views, PDF and ePub downloads, according to the available data) and Abstracts Views on Vision4Press platform.
Data correspond to usage on the plateform after 2015. The current usage metrics is available 48-96 hours after online publication and is updated daily on week days.
Initial download of the metrics may take a while.