Fig. 5
Download original image
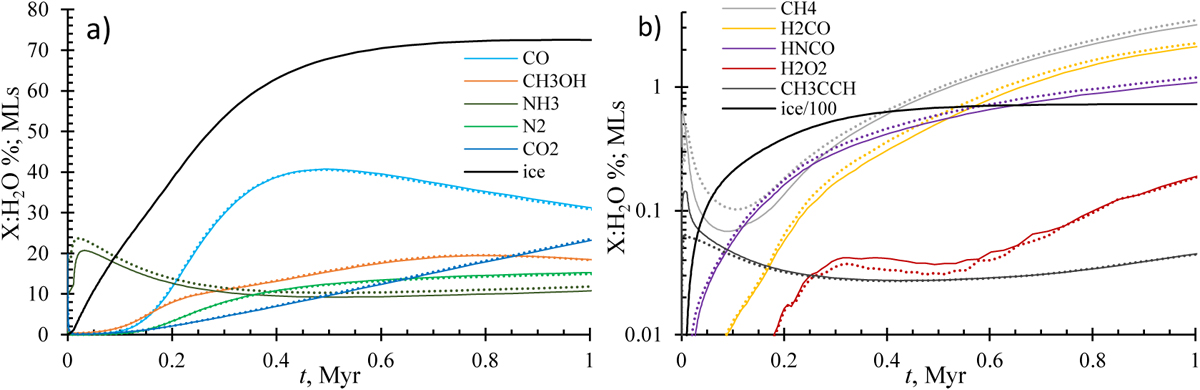
Calculated chemical abundances of icy species in cold core model. Panel a: abundances, relative to those of the H2O ice of major icy molecules. The black curve is the average ice thickness ![]() on grains, expressed in MLs. Panel b: other selected abundant ice molecules. For convenience, this time
on grains, expressed in MLs. Panel b: other selected abundant ice molecules. For convenience, this time ![]() was divided by 100. In both panels, solid lines are for Model const with variable ED, while dotted lines are for Model const_noEd without the variable-ED approach.
was divided by 100. In both panels, solid lines are for Model const with variable ED, while dotted lines are for Model const_noEd without the variable-ED approach.
Current usage metrics show cumulative count of Article Views (full-text article views including HTML views, PDF and ePub downloads, according to the available data) and Abstracts Views on Vision4Press platform.
Data correspond to usage on the plateform after 2015. The current usage metrics is available 48-96 hours after online publication and is updated daily on week days.
Initial download of the metrics may take a while.