Open Access
Fig. 11
Download original image
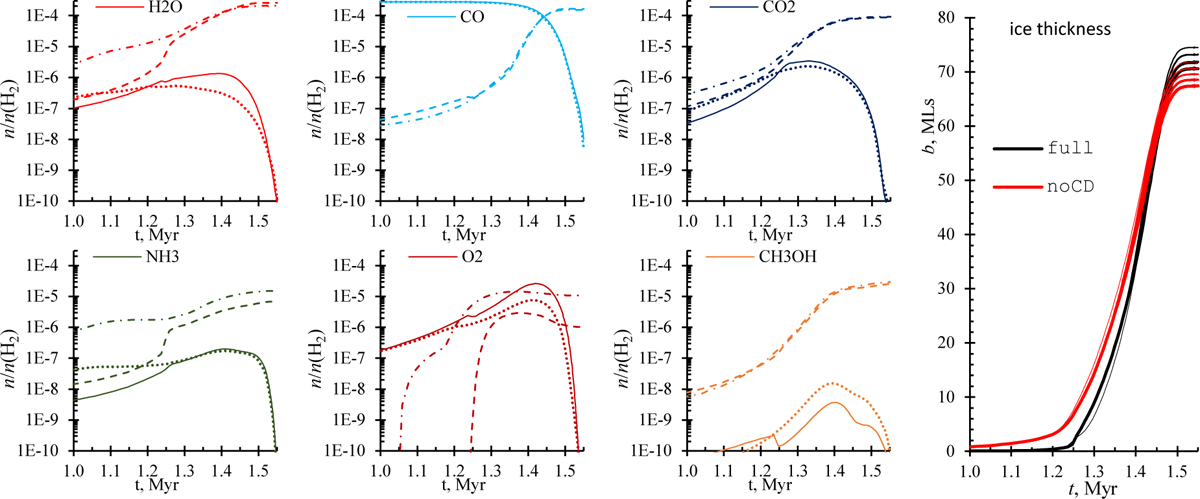
Ice growth and chemical desorption. This is a comparison of abundances between Model full gas (solid lines) and icy (dashed lines) species with those of Model noCD (dotted and dash-dotted lines for gas and ices, respectively). In the ice thickness plot, thicker lines are for larger grains, according to Table 4.
Current usage metrics show cumulative count of Article Views (full-text article views including HTML views, PDF and ePub downloads, according to the available data) and Abstracts Views on Vision4Press platform.
Data correspond to usage on the plateform after 2015. The current usage metrics is available 48-96 hours after online publication and is updated daily on week days.
Initial download of the metrics may take a while.