Open Access
Fig. 2.
Download original image
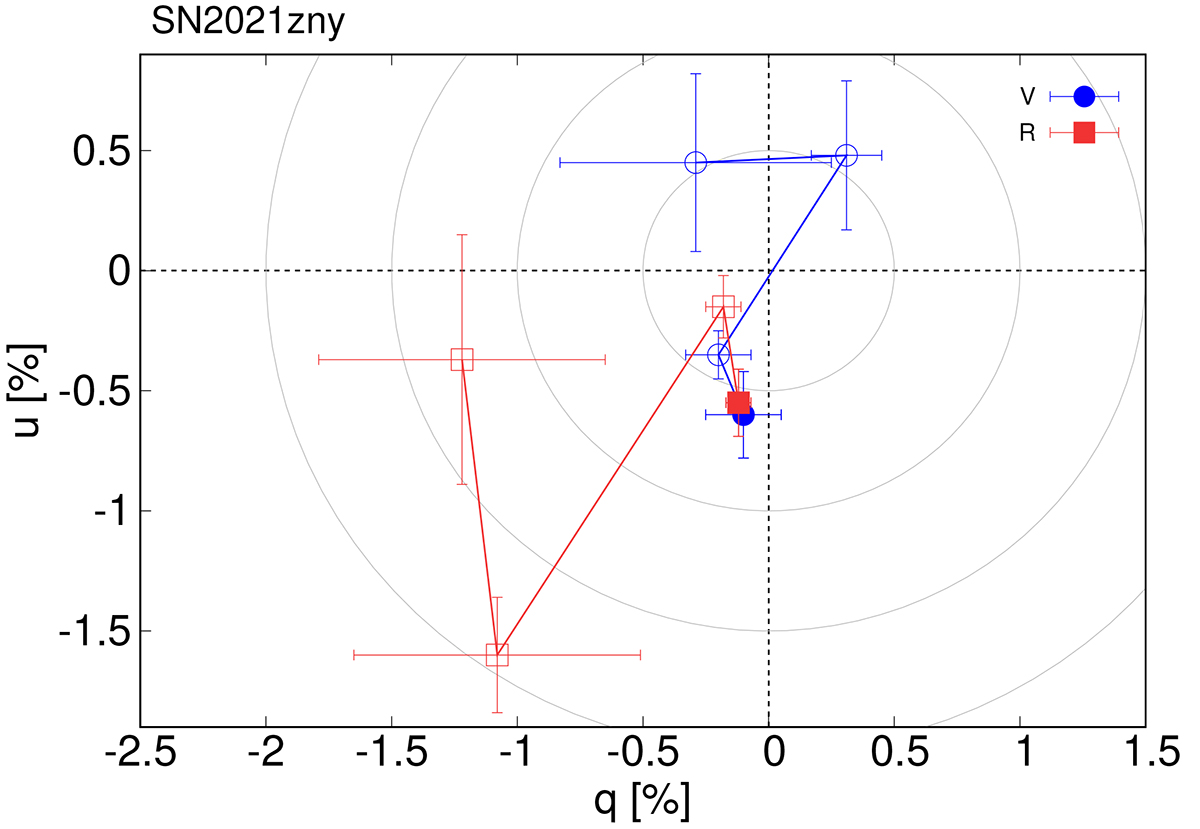
Time evolution of the V- (blue) and R-band (red) polarization in SN 2021zny in the q − u plane. The first-epoch data (Phase −6.33 days) are shown with filled points. The gray lines correspond to the polarization degrees of 0.5, 1.0 and 1.5 % from the origin, respectively.
Current usage metrics show cumulative count of Article Views (full-text article views including HTML views, PDF and ePub downloads, according to the available data) and Abstracts Views on Vision4Press platform.
Data correspond to usage on the plateform after 2015. The current usage metrics is available 48-96 hours after online publication and is updated daily on week days.
Initial download of the metrics may take a while.