Open Access
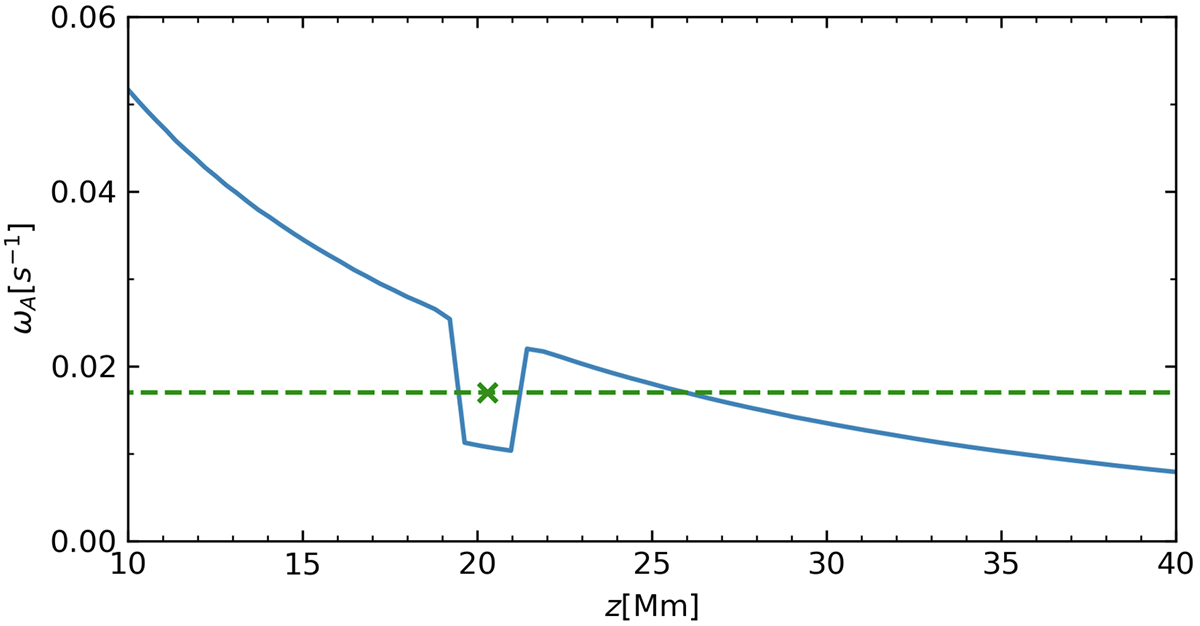
Fig. 5.
Download original image
Alfvén frequency variation along the z-direction at x = 0, y = 0. The cross represents the predicted eigenfrequency of the kink mode in the curved loop, which is calculated from Eq. (12).
Current usage metrics show cumulative count of Article Views (full-text article views including HTML views, PDF and ePub downloads, according to the available data) and Abstracts Views on Vision4Press platform.
Data correspond to usage on the plateform after 2015. The current usage metrics is available 48-96 hours after online publication and is updated daily on week days.
Initial download of the metrics may take a while.