Open Access
Fig. 1.
Download original image
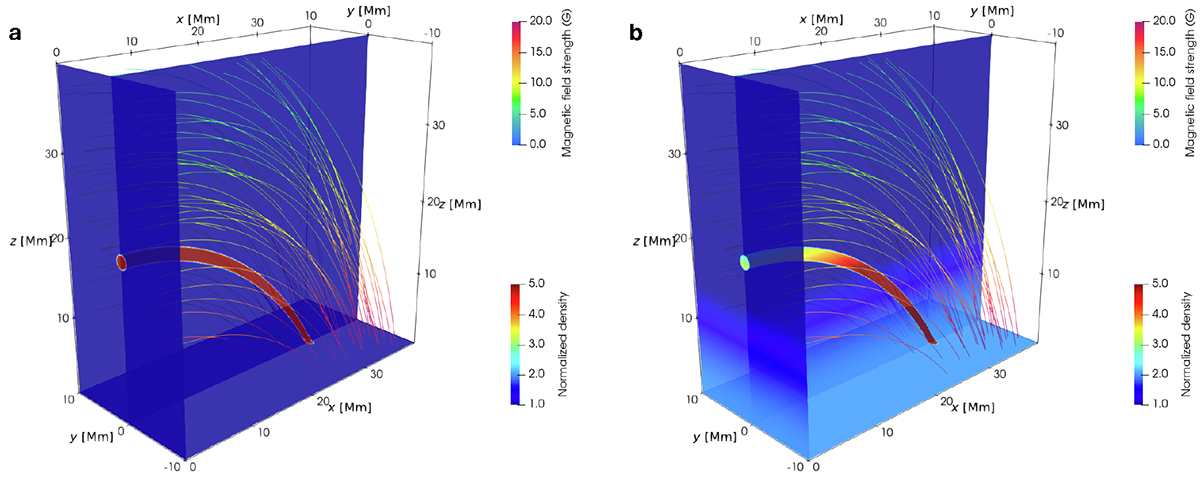
Three-dimensional rendering of the density-enhanced loop. Several arbitrarily selected magnetic field lines are also shown and color-coded by the local magnetic field strength. The left and right panels correspond to our “uniform-density” and “stratified” computations (see text for more details).
Current usage metrics show cumulative count of Article Views (full-text article views including HTML views, PDF and ePub downloads, according to the available data) and Abstracts Views on Vision4Press platform.
Data correspond to usage on the plateform after 2015. The current usage metrics is available 48-96 hours after online publication and is updated daily on week days.
Initial download of the metrics may take a while.