Fig. 7
Download original image
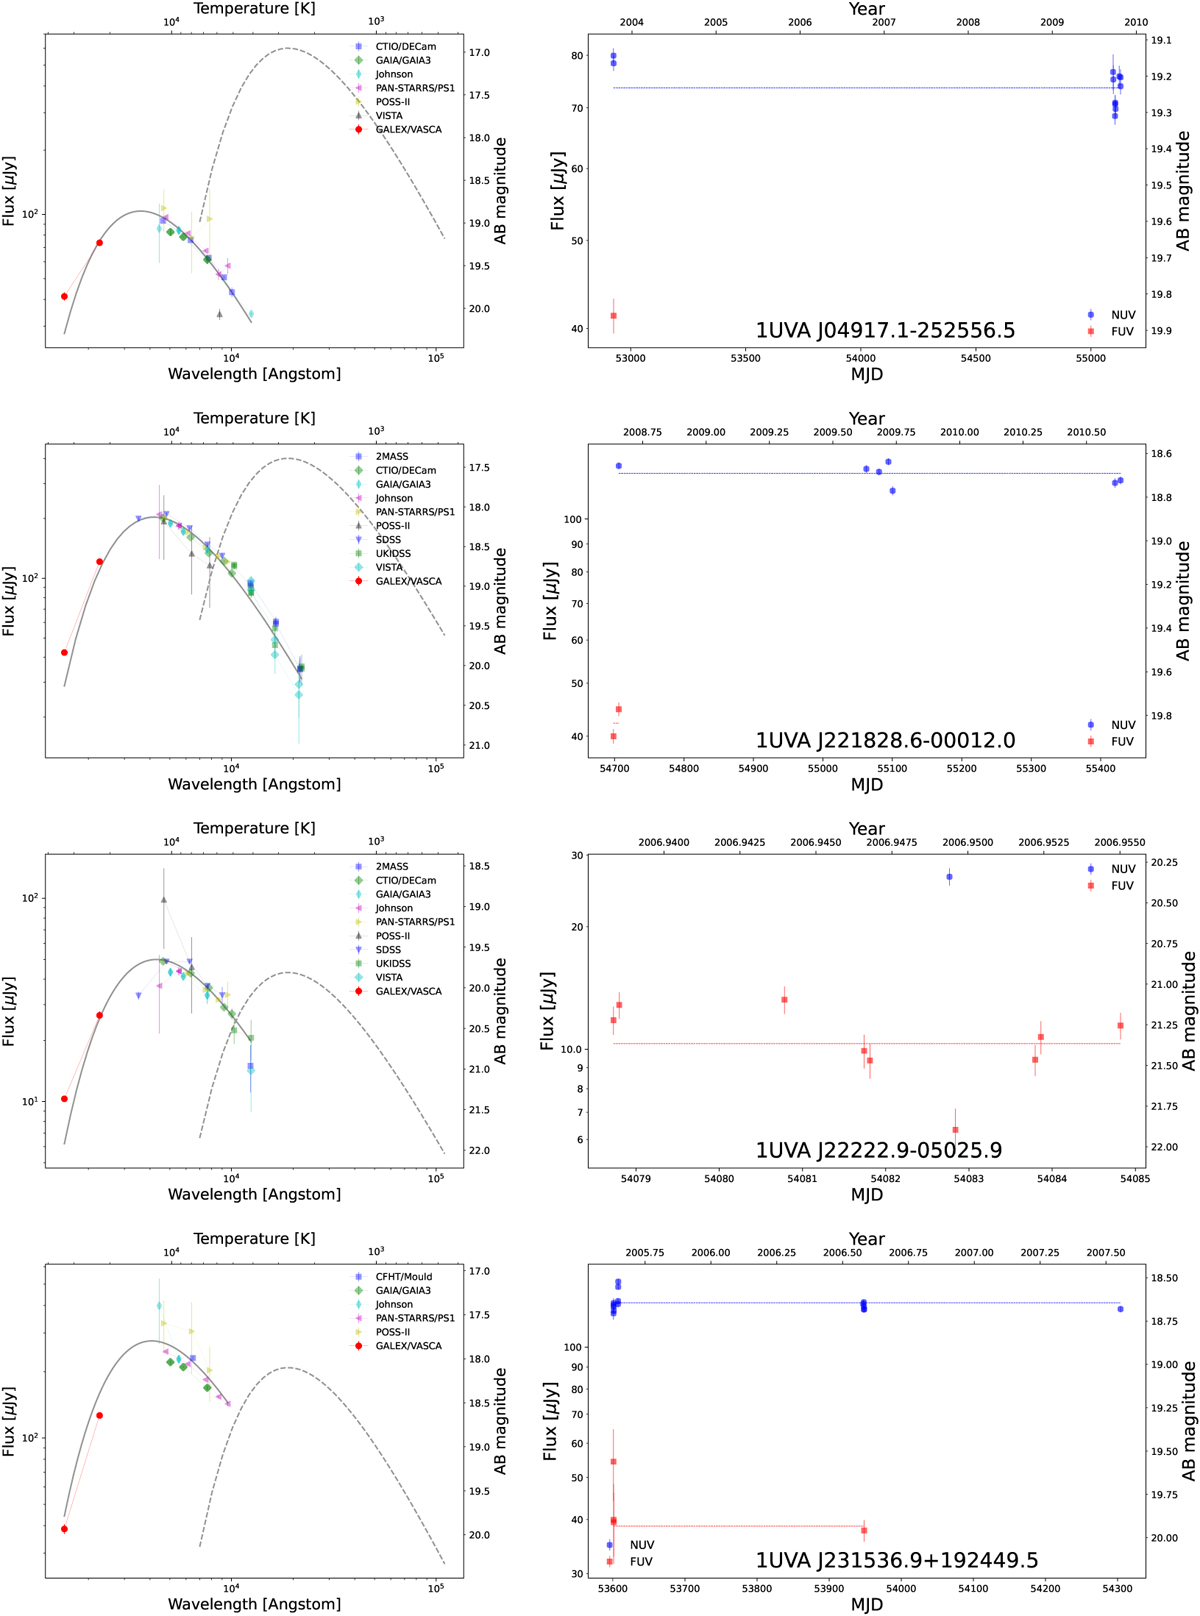
SED (left) and light curve (right) for the sources listed in Table 3. Left: the straight line shows the best fit to a blackbody emission spectrum. The blackbody temperature is given in Table 3. The dashed line shows the SED of a brown dwarf star in a blackbody approximation (see main text). Right: the dashed line shows the mean flux value.
Current usage metrics show cumulative count of Article Views (full-text article views including HTML views, PDF and ePub downloads, according to the available data) and Abstracts Views on Vision4Press platform.
Data correspond to usage on the plateform after 2015. The current usage metrics is available 48-96 hours after online publication and is updated daily on week days.
Initial download of the metrics may take a while.