Fig. 6
Download original image
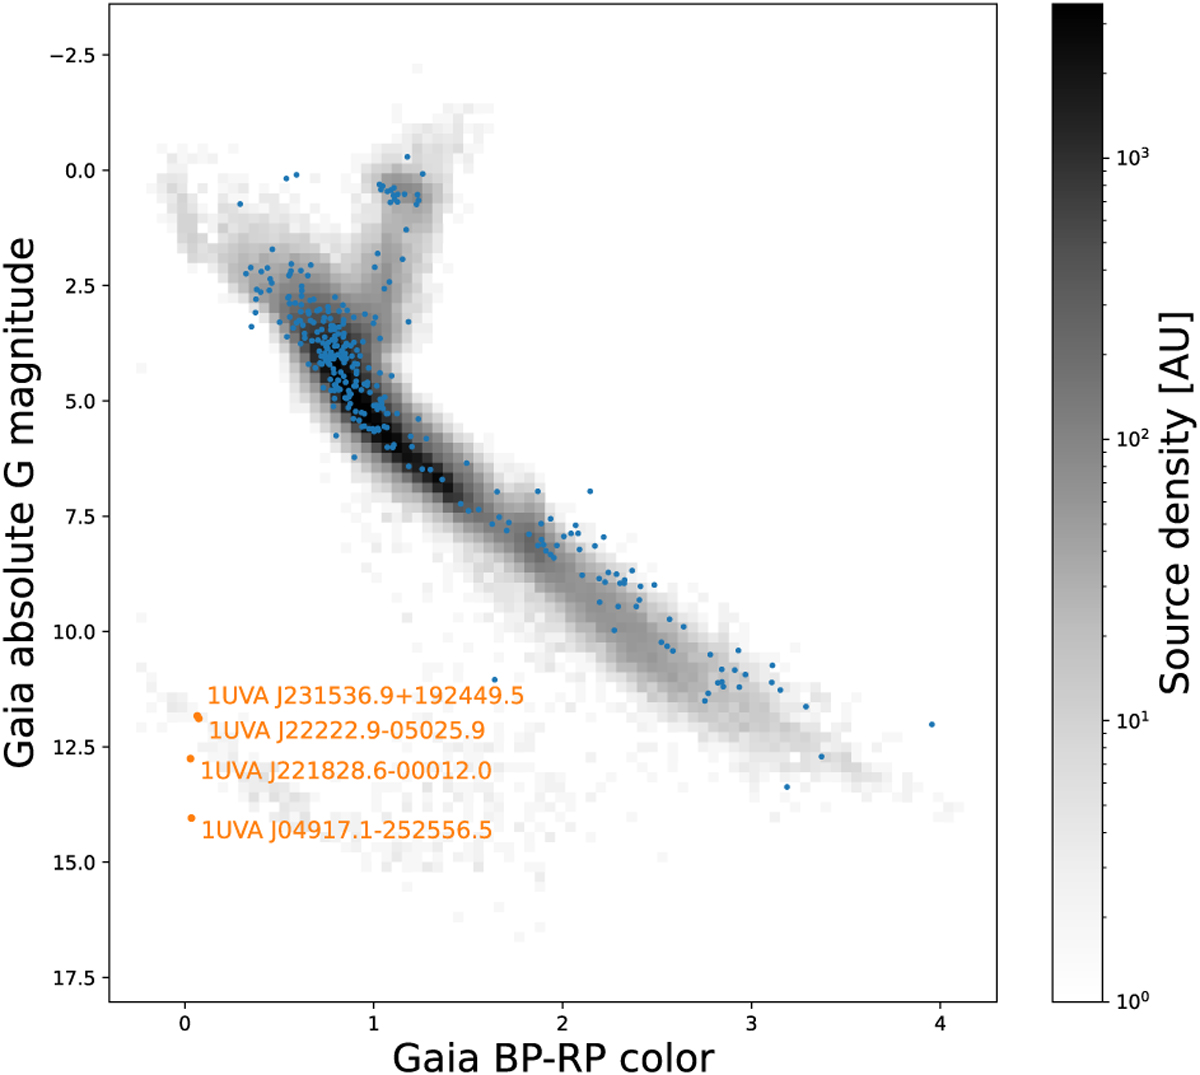
Hertzsprung-Russel (HR) diagram for VASCA sources with Gaia-DR3 counterparts (blue points, see text). The gray background map shows the source density of randomly selected Gaia-DR3 sources for comparison. Gaia source selection cuts are identical in both cases. The orange marker shows the UV-variable WDs discussed in Sect. 3.3.
Current usage metrics show cumulative count of Article Views (full-text article views including HTML views, PDF and ePub downloads, according to the available data) and Abstracts Views on Vision4Press platform.
Data correspond to usage on the plateform after 2015. The current usage metrics is available 48-96 hours after online publication and is updated daily on week days.
Initial download of the metrics may take a while.