Fig. 5
Download original image
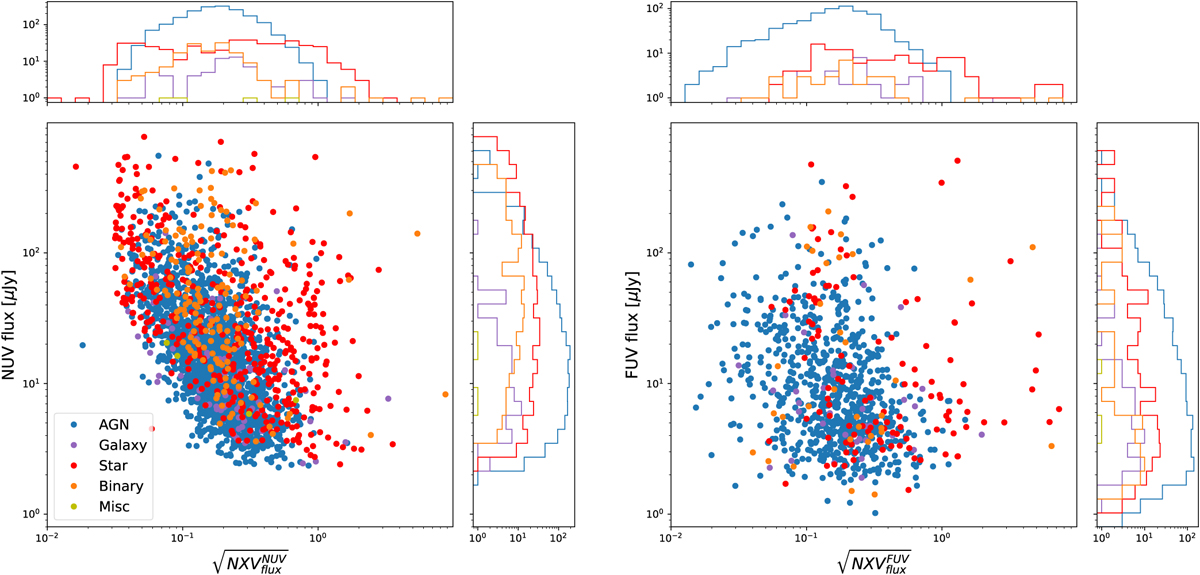
Flux vs. the relative amplitude of flux variations given by the square root of the normalized excess variance as a function of the mean flux for the NUV (left) and FUV (right) passbands. The axis ranges have been kept the same in both bands to facilitate comparison. The subpanels at the top and right of each image show the total number of sources projected onto the respective axis.
Current usage metrics show cumulative count of Article Views (full-text article views including HTML views, PDF and ePub downloads, according to the available data) and Abstracts Views on Vision4Press platform.
Data correspond to usage on the plateform after 2015. The current usage metrics is available 48-96 hours after online publication and is updated daily on week days.
Initial download of the metrics may take a while.