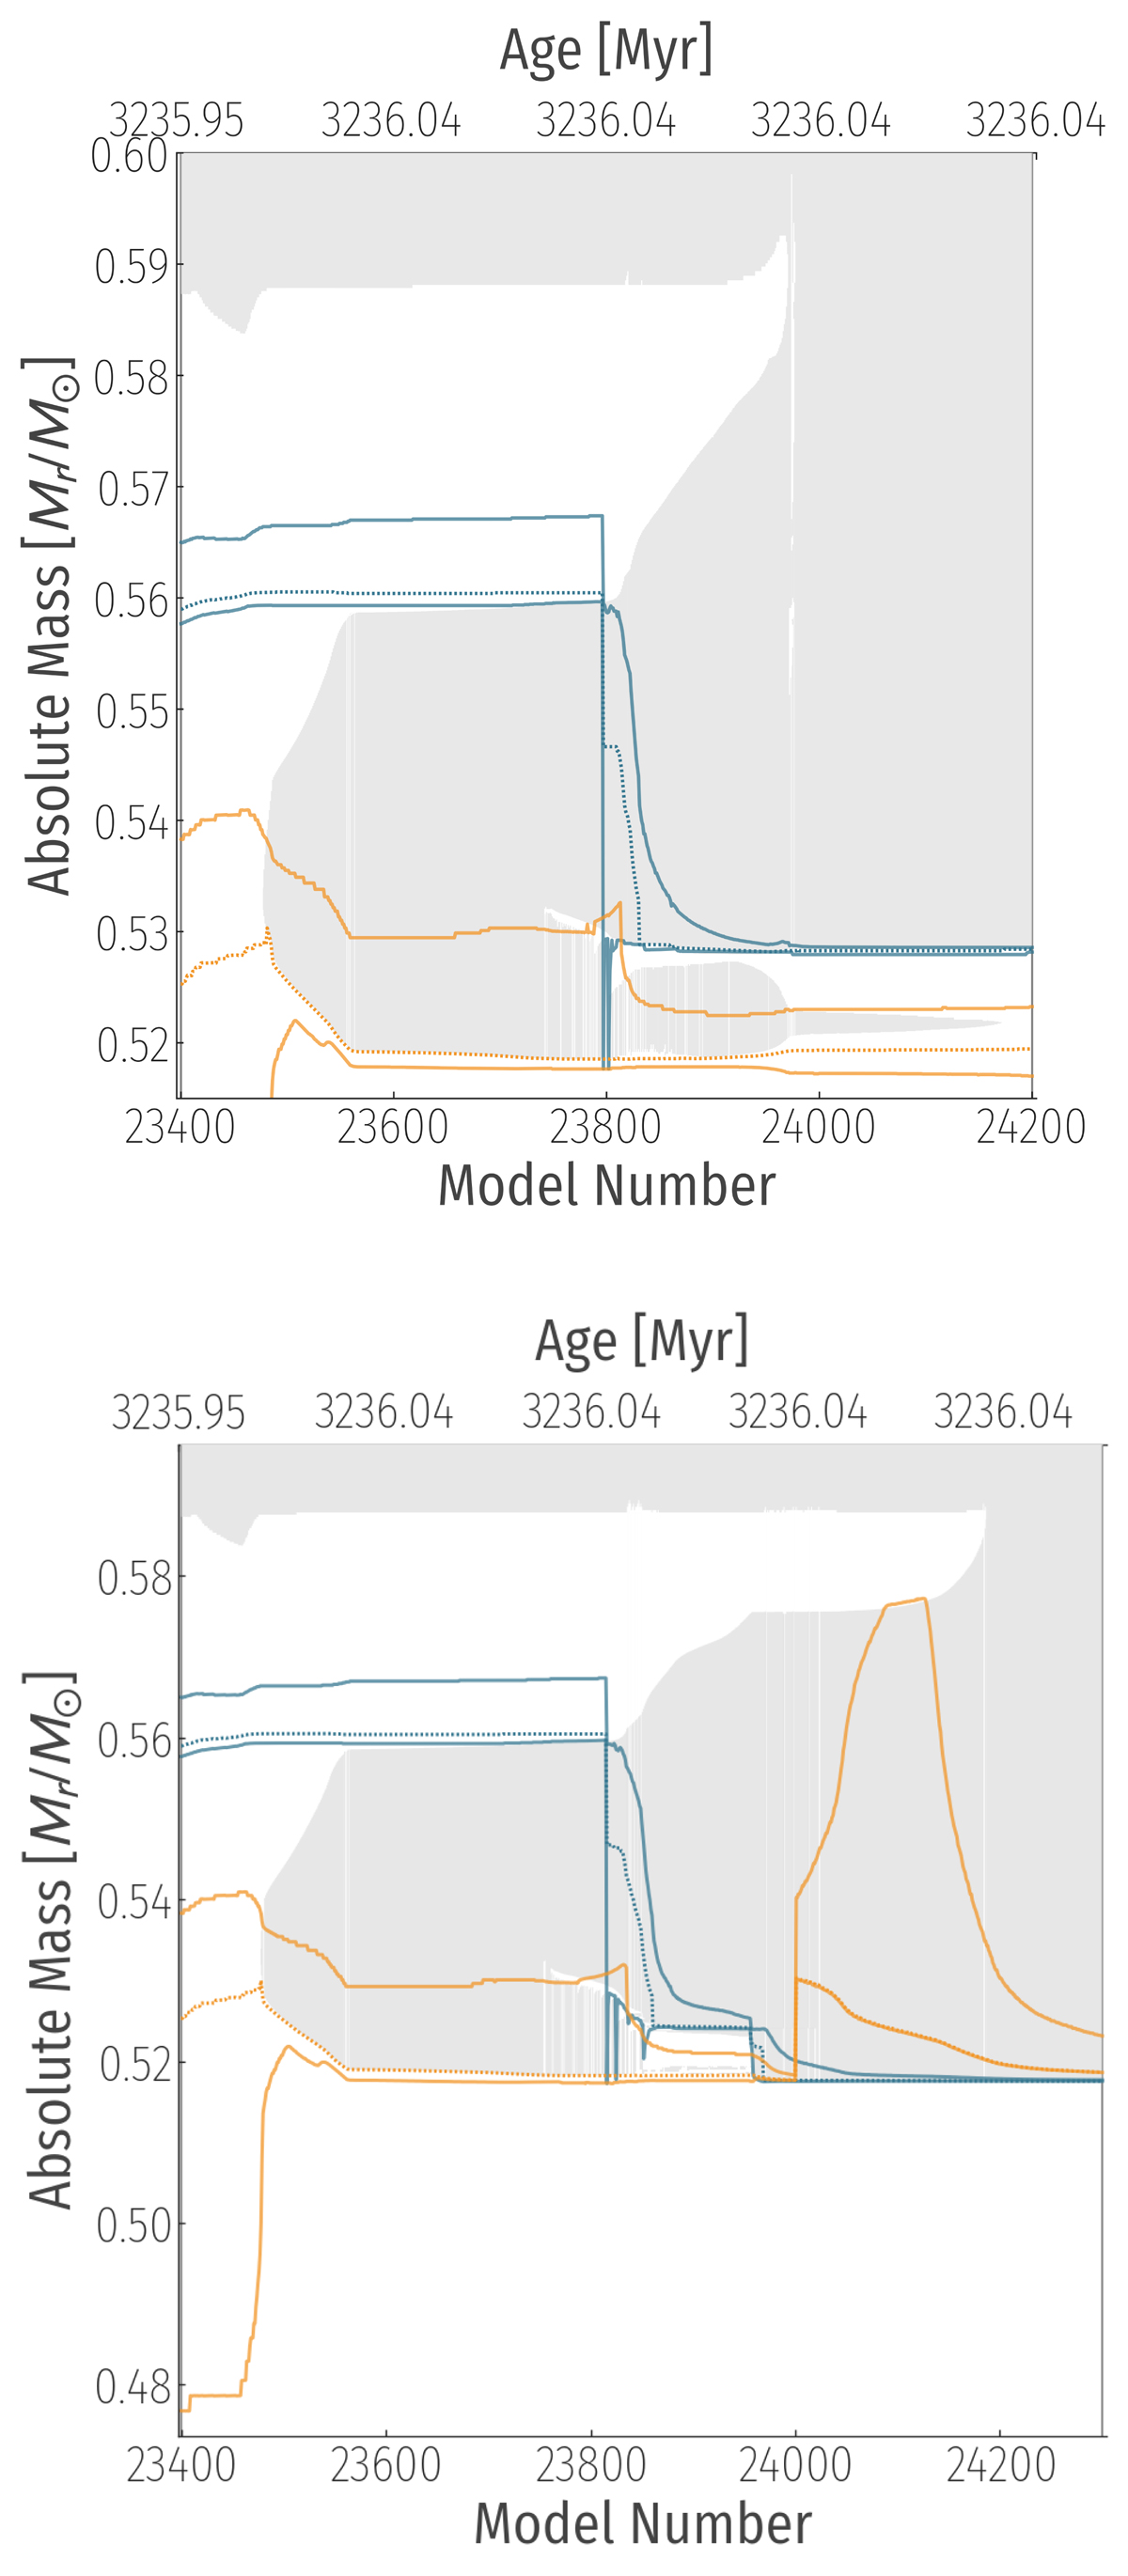
Fig. 4.
Download original image
Kippenhahn diagrams (see Fig. 3 for an explanation of the plot elements) of a PIE. Top panel: the |fPDCZ| = 0.016, |fCE| = 0.016 track experiences a partial remerging that occurs around model 23 800. Additionally, one can see the dredge-up-like event that happens when the upper part of the split PDCZ descends into the region below the split point. Bottom panel: the |fPDCZ| = 0.016, |fCE| = 0.016 track without the geometrical cut-off to the overshoot experiences a permanent remerging.
Current usage metrics show cumulative count of Article Views (full-text article views including HTML views, PDF and ePub downloads, according to the available data) and Abstracts Views on Vision4Press platform.
Data correspond to usage on the plateform after 2015. The current usage metrics is available 48-96 hours after online publication and is updated daily on week days.
Initial download of the metrics may take a while.