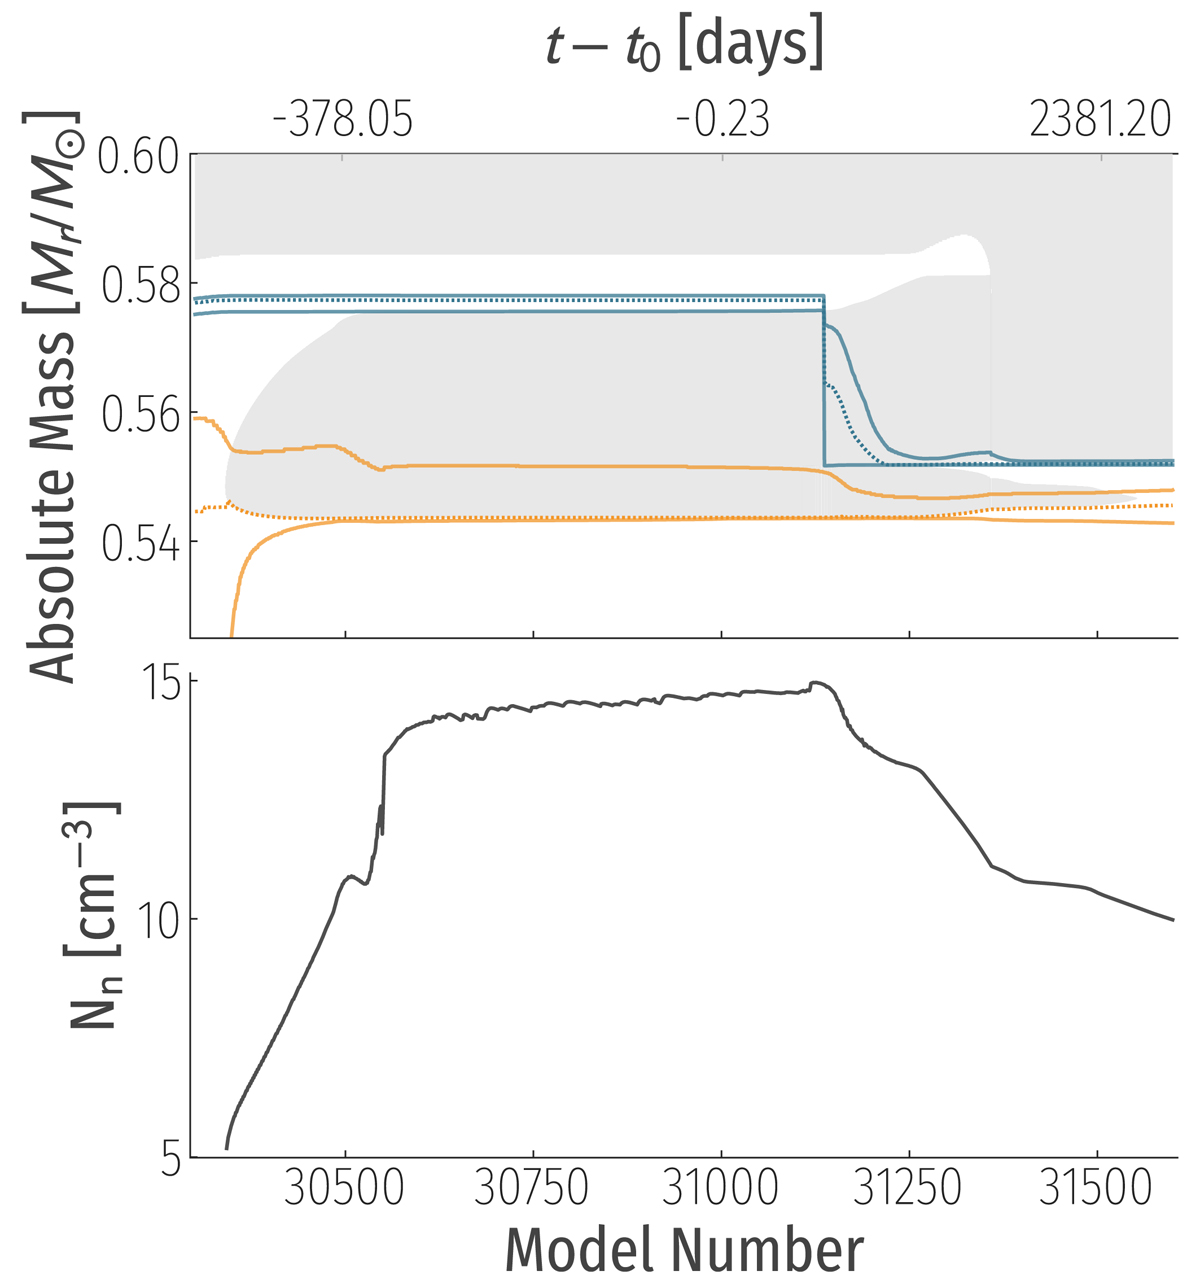
Fig. 3.
Download original image
Kippenhahn diagrams showing the structure of the fiducial model (top) and the maximum neutron density (bottom). Time is shown as model number on the lower x-axis and as time in days relative to the maximum neutron density in the upper x-axis. In the Kippenhahn diagram the top and bottom of the H shell is denoted by the solid blue lines with the dotted blue line following the point of maximum H burning in the shell. The top and the bottom of the He shell is denoted by the solid orange lines with the orange dashed line following the point of maximum He burning in the shell. Formally Convective regions are shown in gray.
Current usage metrics show cumulative count of Article Views (full-text article views including HTML views, PDF and ePub downloads, according to the available data) and Abstracts Views on Vision4Press platform.
Data correspond to usage on the plateform after 2015. The current usage metrics is available 48-96 hours after online publication and is updated daily on week days.
Initial download of the metrics may take a while.