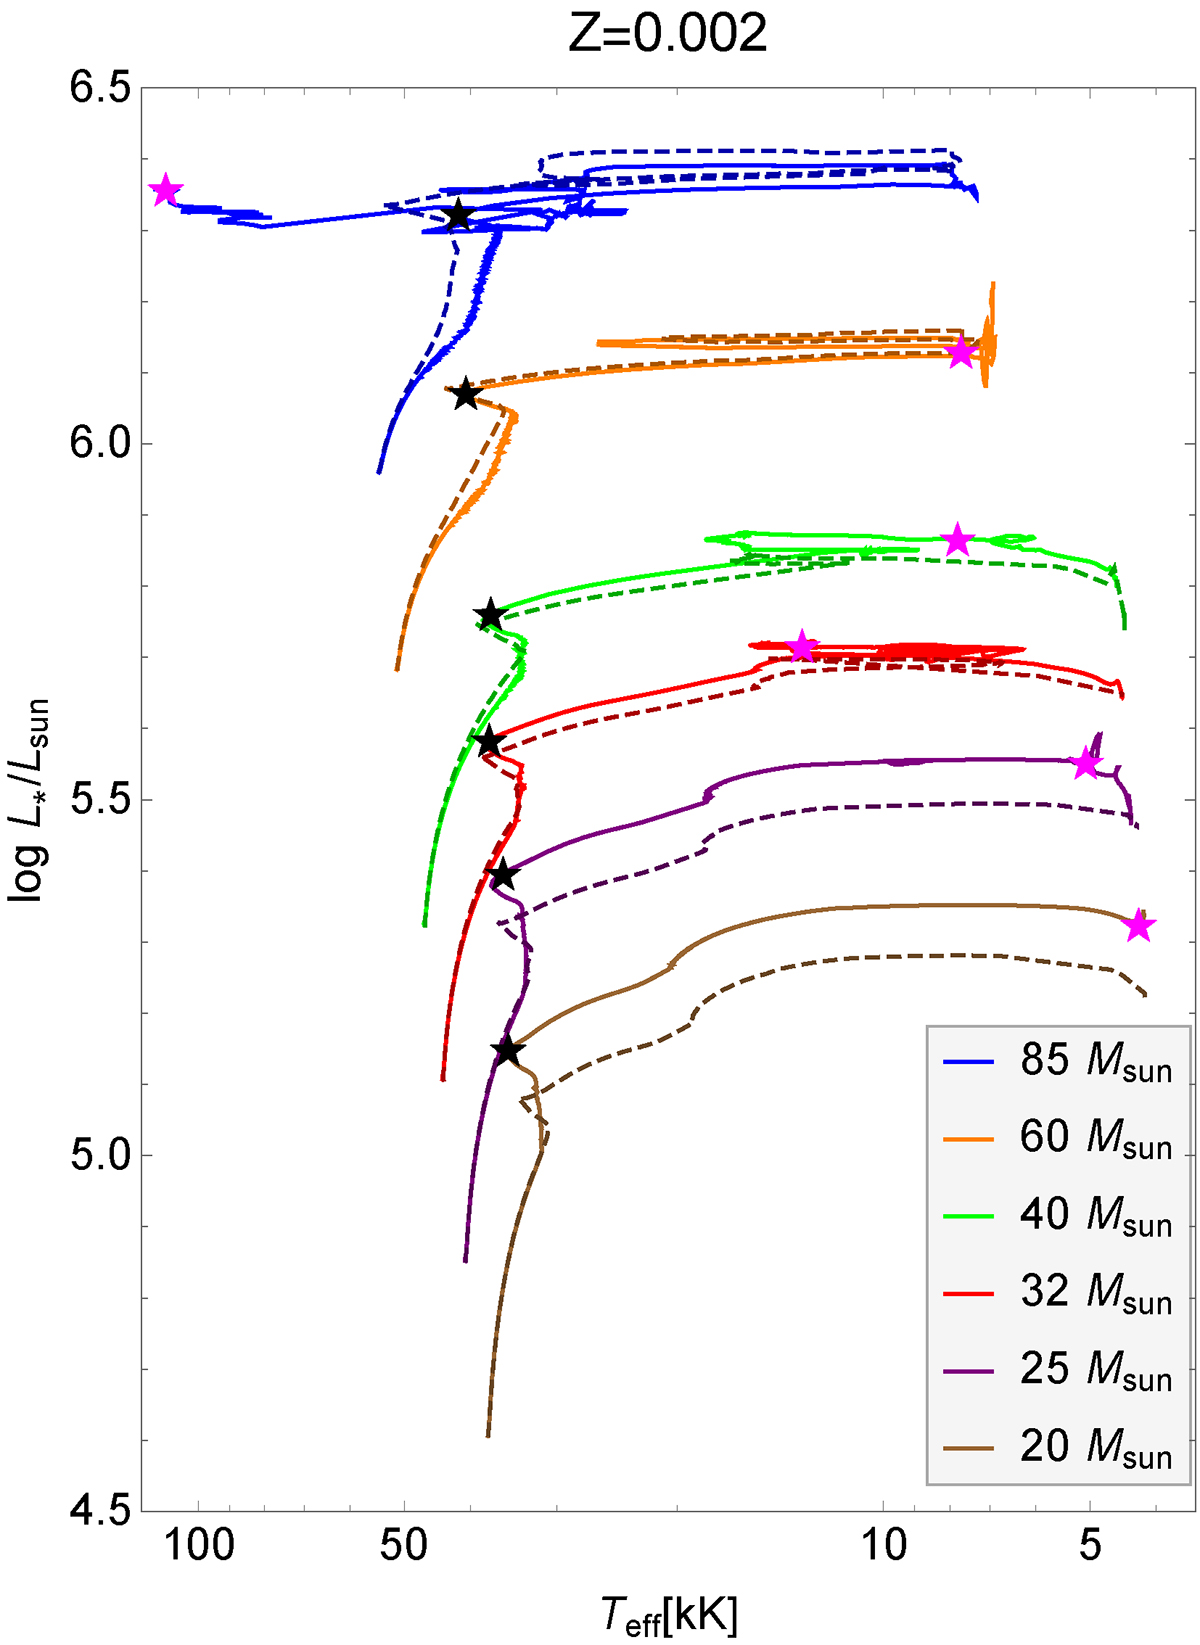
Fig. 2.
Download original image
Tracks across HR diagram for evolution models adopting Msc (solid lines), compared with tracks adopting MVink from Georgy et al. (2013; dashed lines). New wind prescription gives values for Ṁ around ∼2 − 6 times lower than the mass-loss adopted for old models, as visualised in Fig. 3. Black stars mark the end of the H-core burning stage, whereas magenta stars mark the end of the He-core burning stage.
Current usage metrics show cumulative count of Article Views (full-text article views including HTML views, PDF and ePub downloads, according to the available data) and Abstracts Views on Vision4Press platform.
Data correspond to usage on the plateform after 2015. The current usage metrics is available 48-96 hours after online publication and is updated daily on week days.
Initial download of the metrics may take a while.