Open Access
Fig. 5
Download original image
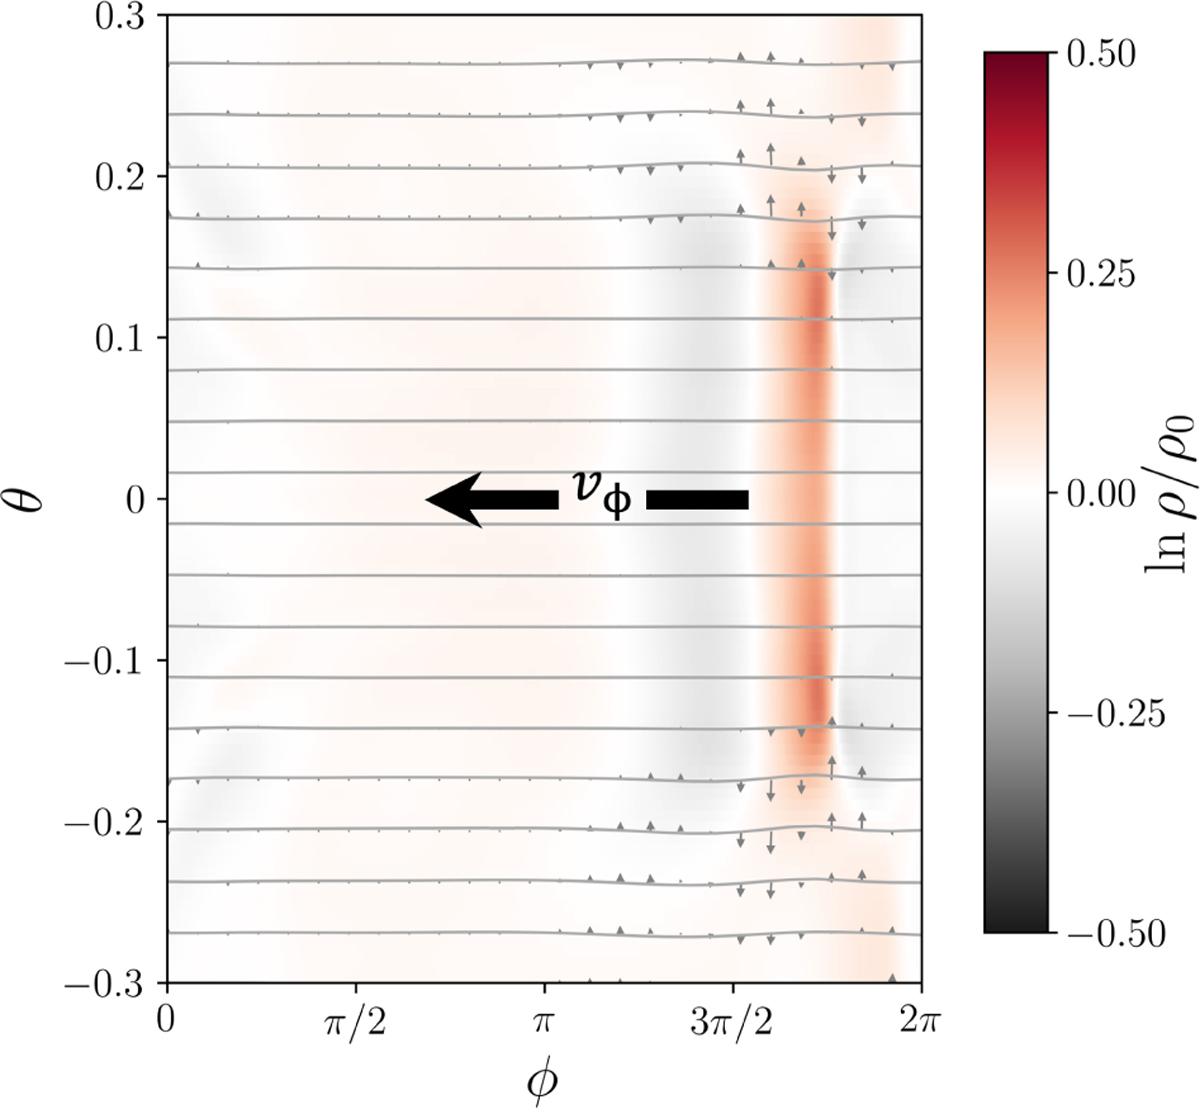
Flow pattern at r = 1.5rp = 60au in an azimuthal cut of the disk. Streamlines flow from right to left; unlike in Fig. 4, vector arrows represent velocity differences from the local initial (quasi-)Keplerian value, rather than from the planet’s Keplerian speed.
Current usage metrics show cumulative count of Article Views (full-text article views including HTML views, PDF and ePub downloads, according to the available data) and Abstracts Views on Vision4Press platform.
Data correspond to usage on the plateform after 2015. The current usage metrics is available 48-96 hours after online publication and is updated daily on week days.
Initial download of the metrics may take a while.