Open Access
Fig. 9
Download original image
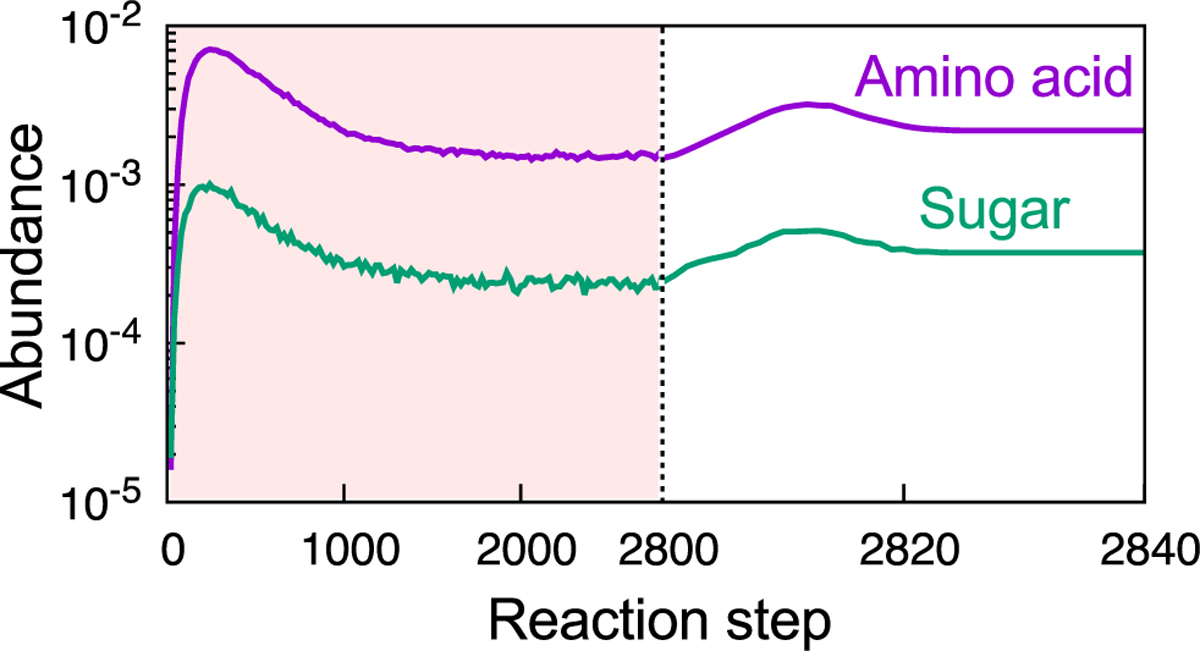
Evolution of the abundances of amino acids (magenta curve) and sugars (green curve) as a function of reaction steps. The parameters and initial molecules used are the fiducial set shown in Sect. 3.1.
Current usage metrics show cumulative count of Article Views (full-text article views including HTML views, PDF and ePub downloads, according to the available data) and Abstracts Views on Vision4Press platform.
Data correspond to usage on the plateform after 2015. The current usage metrics is available 48-96 hours after online publication and is updated daily on week days.
Initial download of the metrics may take a while.