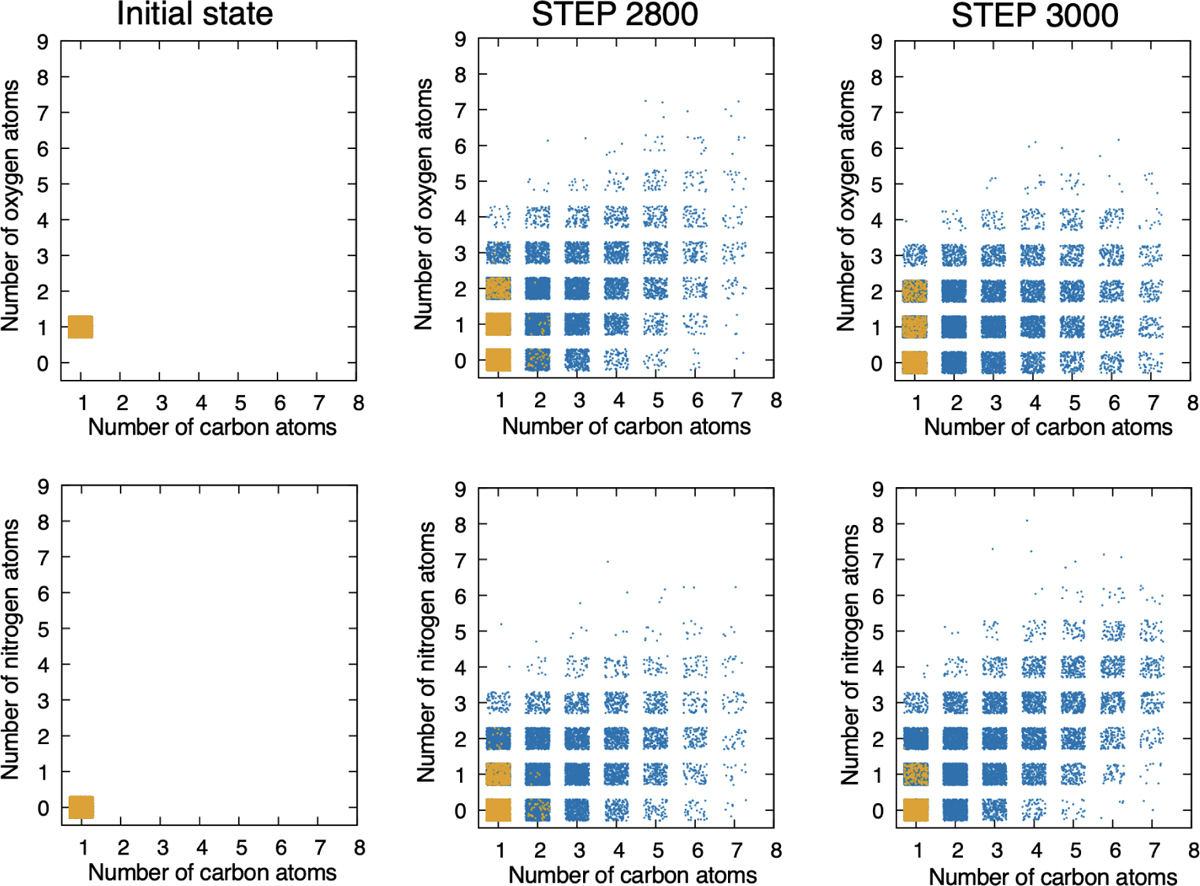
Fig. 8

Download original image
Distributions of the numbers of carbon atoms and oxygen atoms (the upper panels) and carbon atoms and nitrogen atoms (the lower panels) included in an individual molecule, at the initial state, the end of the UV phase, and the end of the post UV phase from the left to the right, respectively. The results are obtained with 5000 runs. The blue dots represent the molecules with six or more atoms (COMs), and the orange dots represent others. We note that relatively small COMs such as methanol are hidden behind the orange dots (including at the initial state.) For visual convenience, the points are randomly shifted in the range of ±0.3 from the center.
Current usage metrics show cumulative count of Article Views (full-text article views including HTML views, PDF and ePub downloads, according to the available data) and Abstracts Views on Vision4Press platform.
Data correspond to usage on the plateform after 2015. The current usage metrics is available 48-96 hours after online publication and is updated daily on week days.
Initial download of the metrics may take a while.


