Fig. 7
Download original image
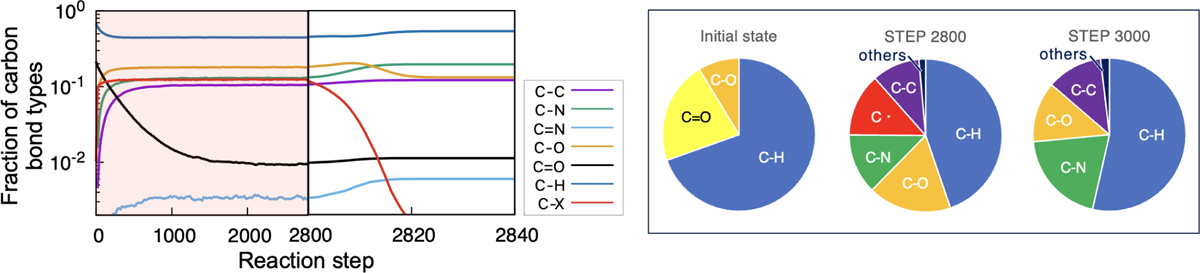
Fraction change in carbon bond types as a function of reaction steps with a logarithmic scale (the left panel) and its pie chart (the right panel) at the initial state, the end of the UV phase, and the end of the post UV phase from the left to the right, respectively. In the left panel, the bond-types with less than 0.1% throughout the reaction steps are excluded.
Current usage metrics show cumulative count of Article Views (full-text article views including HTML views, PDF and ePub downloads, according to the available data) and Abstracts Views on Vision4Press platform.
Data correspond to usage on the plateform after 2015. The current usage metrics is available 48-96 hours after online publication and is updated daily on week days.
Initial download of the metrics may take a while.