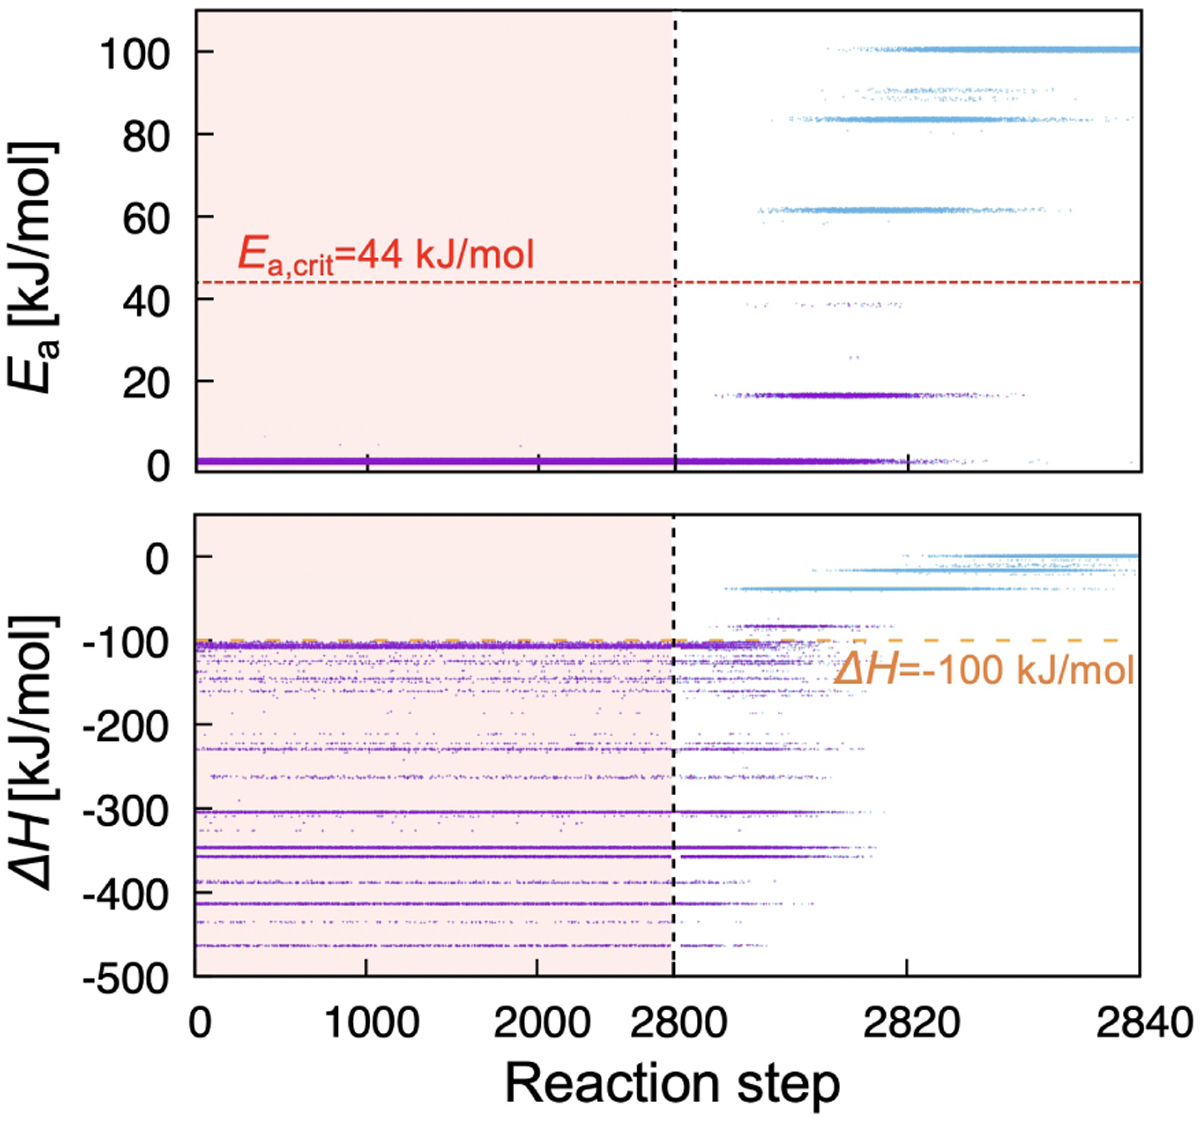
Fig. 6
Download original image
Activation energy, Ea, (upper panel) and the enthalpy change, ΔH, (lower panel) of type 2, 3, and 4 reactions selected in each step. The red dashed line shows the critical activation energy (Ea,crit = 44 kJ mol−1) under the fiducial timescale and temperature. The orange dashed line shows the threshold (ΔH = −100 km mol−1) which gives Ea,crit = 0 under α = 1.0 and β = 100 kJ mol−1 (see Sect. 2.4.2). For visual convenience, we arbitrarily selected the number of plotting data and randomly shifted the points vertically and horizontally with the small amplitude. The magenta dots are results with Eacrit = 44 kJ mol−1 and the light blue dots are results from the same initial conditions but without limiting Eacrit. They show that the activation energy of the selected reaction is limited by the Eacrit setting. We note that in most steps the light blue dots are hidden by the magenta dots.
Current usage metrics show cumulative count of Article Views (full-text article views including HTML views, PDF and ePub downloads, according to the available data) and Abstracts Views on Vision4Press platform.
Data correspond to usage on the plateform after 2015. The current usage metrics is available 48-96 hours after online publication and is updated daily on week days.
Initial download of the metrics may take a while.