Fig. 4
Download original image
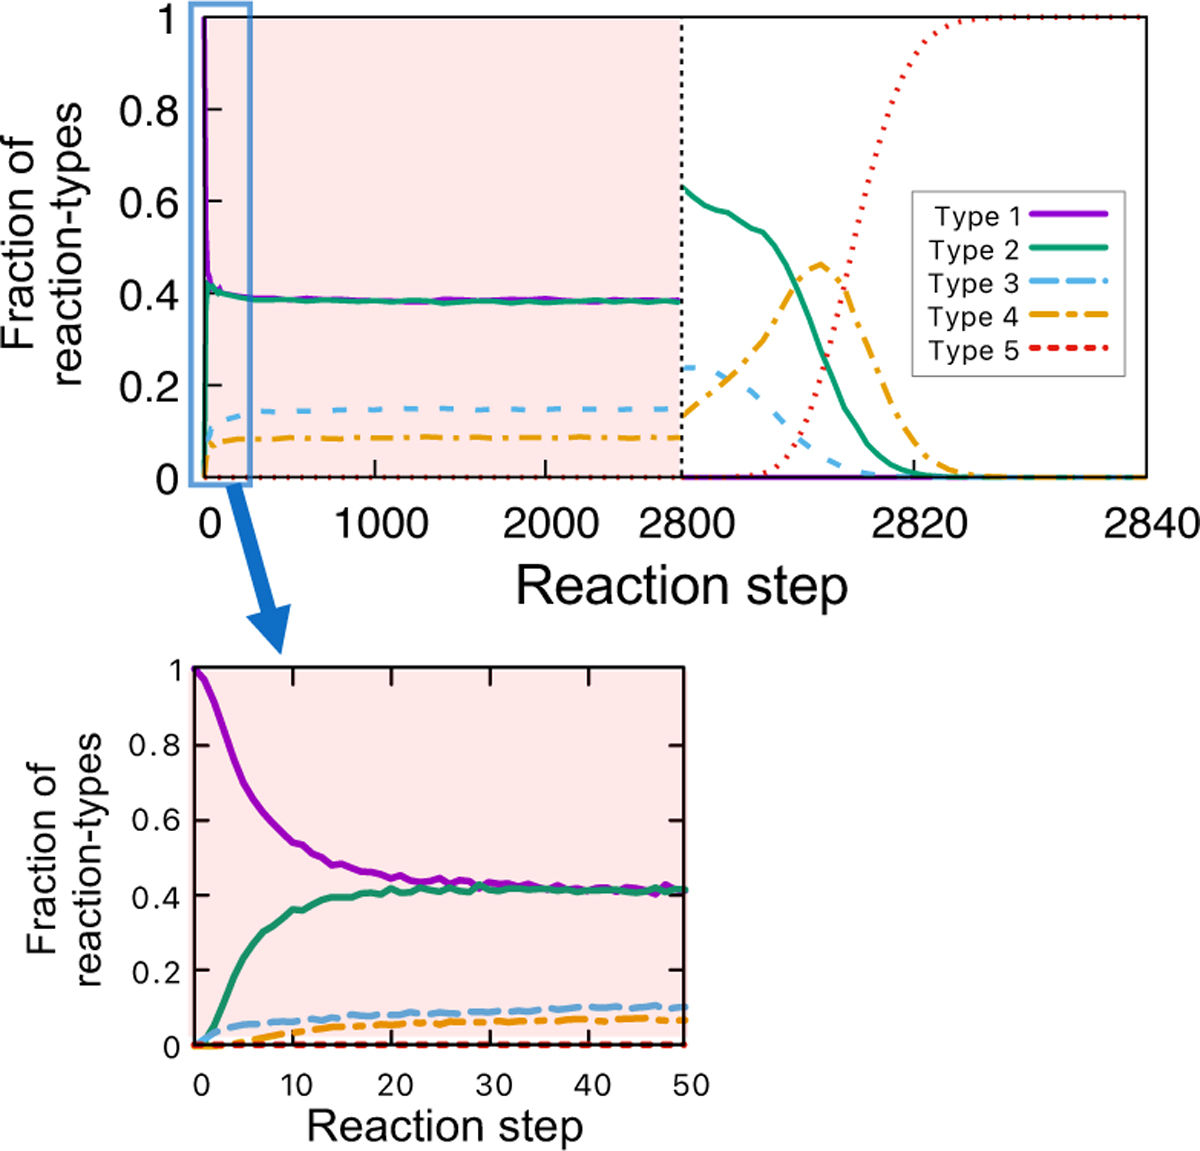
Fraction change in the five reaction types defined in Sect. 3.2. The parameters and initial molecules used are shown in Sect. 3.1. Reaction types 1, 2, 3, 4, and 5 are represented by the magenta solid, green solid, light-blue dashed, orange dash-dotted, and red dotted lines, respectively. The red shaded region corresponds to the UV phase. The bottom figure is a stretched view of up to step 50. The horizontal scales are different between the UV phase and the post-UV phase for visual convenience.
Current usage metrics show cumulative count of Article Views (full-text article views including HTML views, PDF and ePub downloads, according to the available data) and Abstracts Views on Vision4Press platform.
Data correspond to usage on the plateform after 2015. The current usage metrics is available 48-96 hours after online publication and is updated daily on week days.
Initial download of the metrics may take a while.