Fig. 15
Download original image
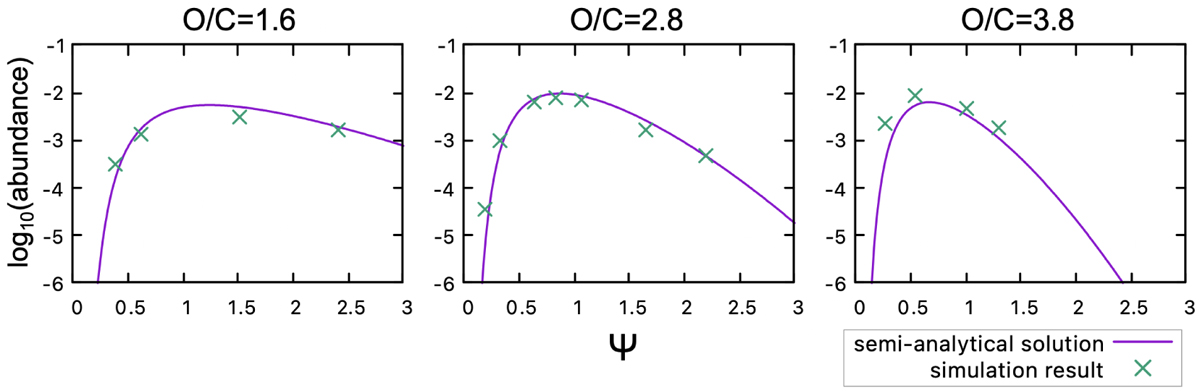
Final abundance distribution of amino acids as a function of Ψ with O/C ~ 1.6, 2.8, and 3.8. The result of the Monte Carlo simulations is plotted by a green x mark, and the prediction by the semi-analytical formula (Eq. (23)) is plotted by a magenta curve. The O/C ratios of the molecular sets used in the plot contain a maximum error margin of about 9%.
Current usage metrics show cumulative count of Article Views (full-text article views including HTML views, PDF and ePub downloads, according to the available data) and Abstracts Views on Vision4Press platform.
Data correspond to usage on the plateform after 2015. The current usage metrics is available 48-96 hours after online publication and is updated daily on week days.
Initial download of the metrics may take a while.