Fig. 6
Download original image
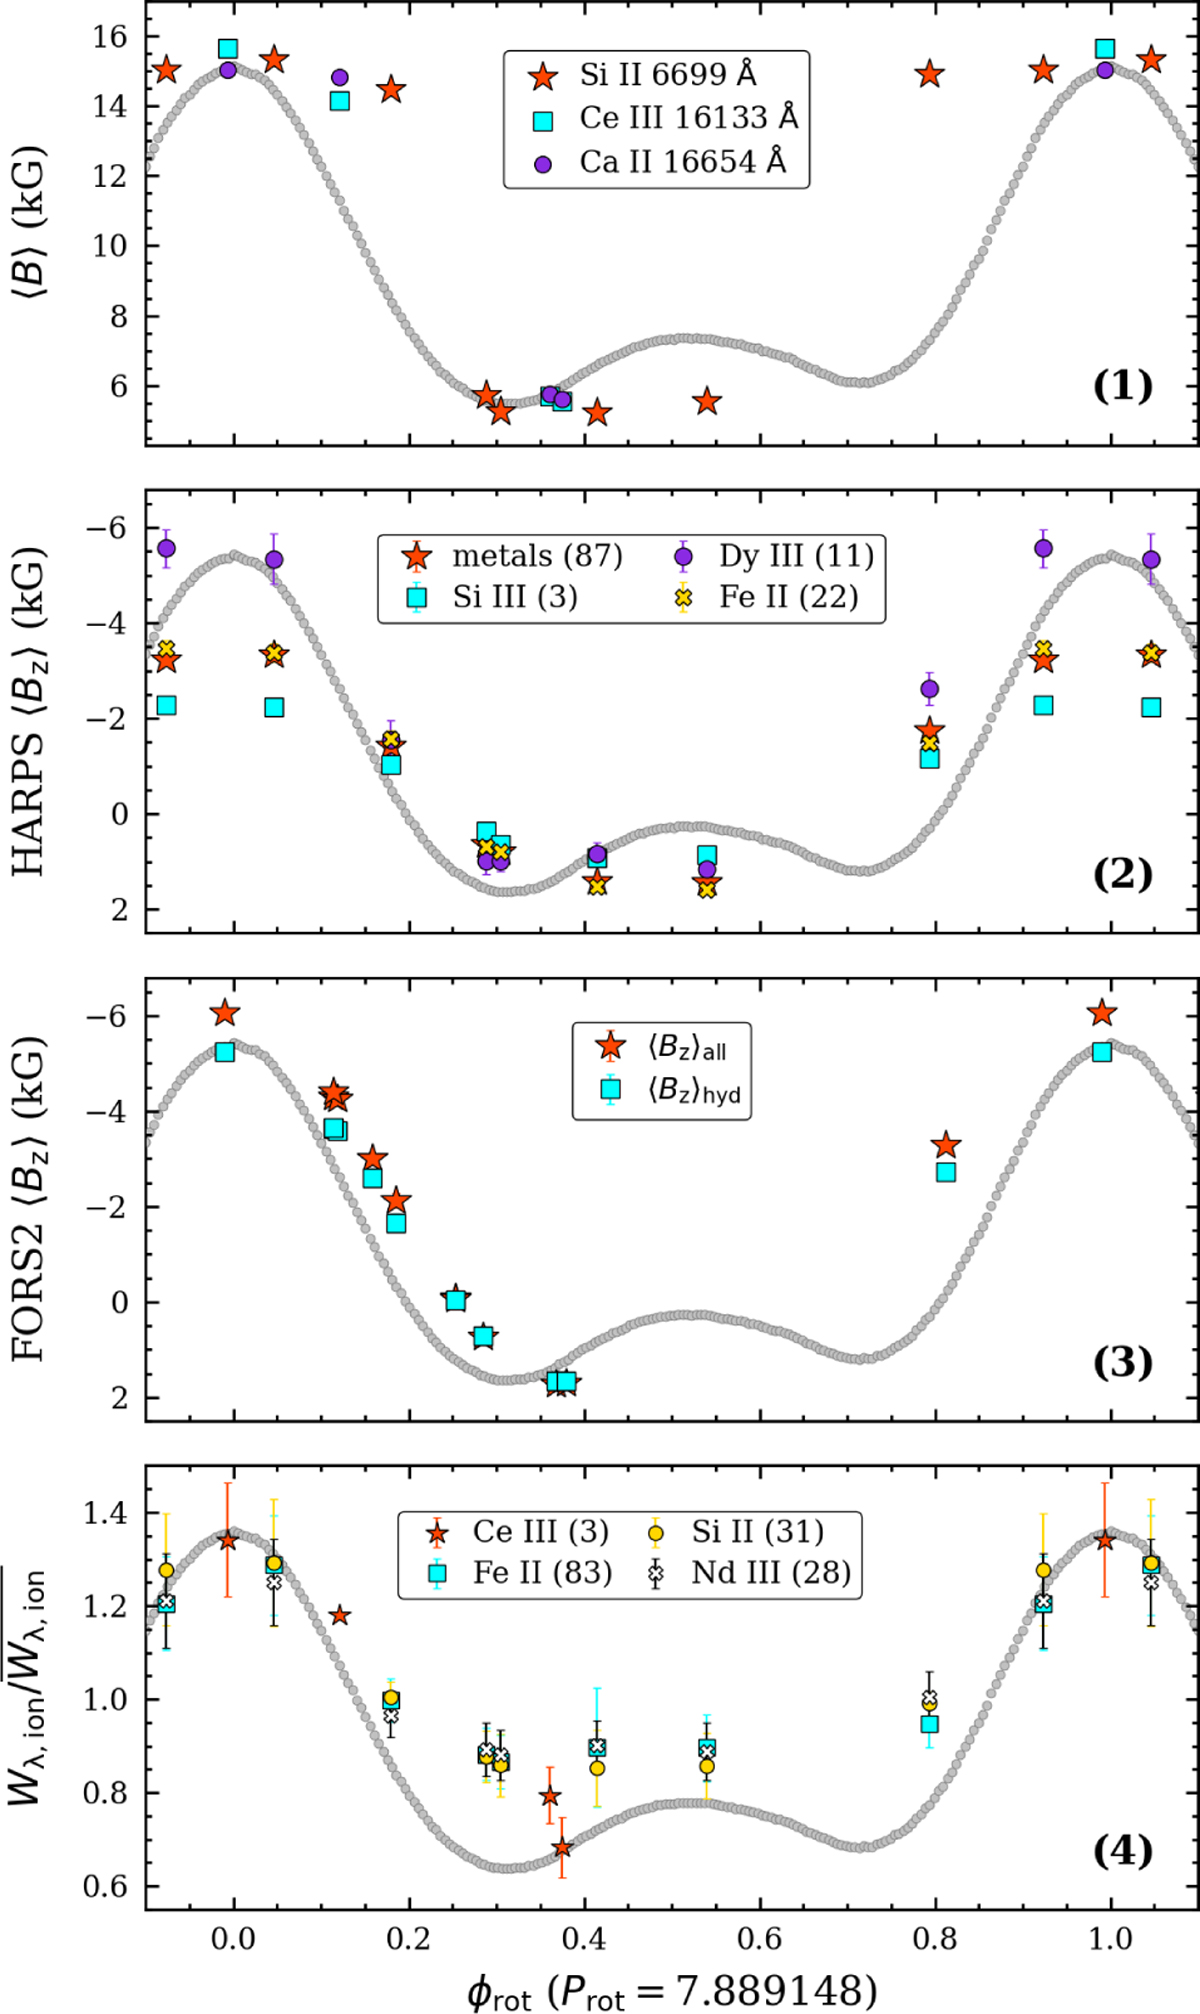
Variability of HD 57372 as a function of rotation phase. The phase-binned TESS light curve (magenta points in Fig. 1) is shown as grey points in each panel. The ordinate scaling of the light curve is similar to that of the bottom panel of Fig. 1, but the associated y-axis tick labels have been omitted to emphasise the units of the scatter points. Panel 1 shows the 〈B〉 estimates from the Si II 6699 Å line in the HARPS spectra and from the Ce III 16133 Å and Ca II 16654 Å lines in the APOGEE spectra. Panel 2 shows the HARPS 〈Bz〉 measurements, including those obtained from numerous metal lines, from three Si III lines, from 11 Dy III lines, and from 22 Fe II lines. These ions were selected simply to demonstrate the larger degree of scatter in 〈Bz〉 when 〈B〉 is high. Panel 3 shows the 〈Bz〉 measurements from the FORS2 data, including those from the full spectra and those from the hydrogen lines. Panel 4 shows the equivalent width variations for four example ions, with the numbers of lines averaged for each ion given in parentheses.
Current usage metrics show cumulative count of Article Views (full-text article views including HTML views, PDF and ePub downloads, according to the available data) and Abstracts Views on Vision4Press platform.
Data correspond to usage on the plateform after 2015. The current usage metrics is available 48-96 hours after online publication and is updated daily on week days.
Initial download of the metrics may take a while.