Fig. 1
Download original image
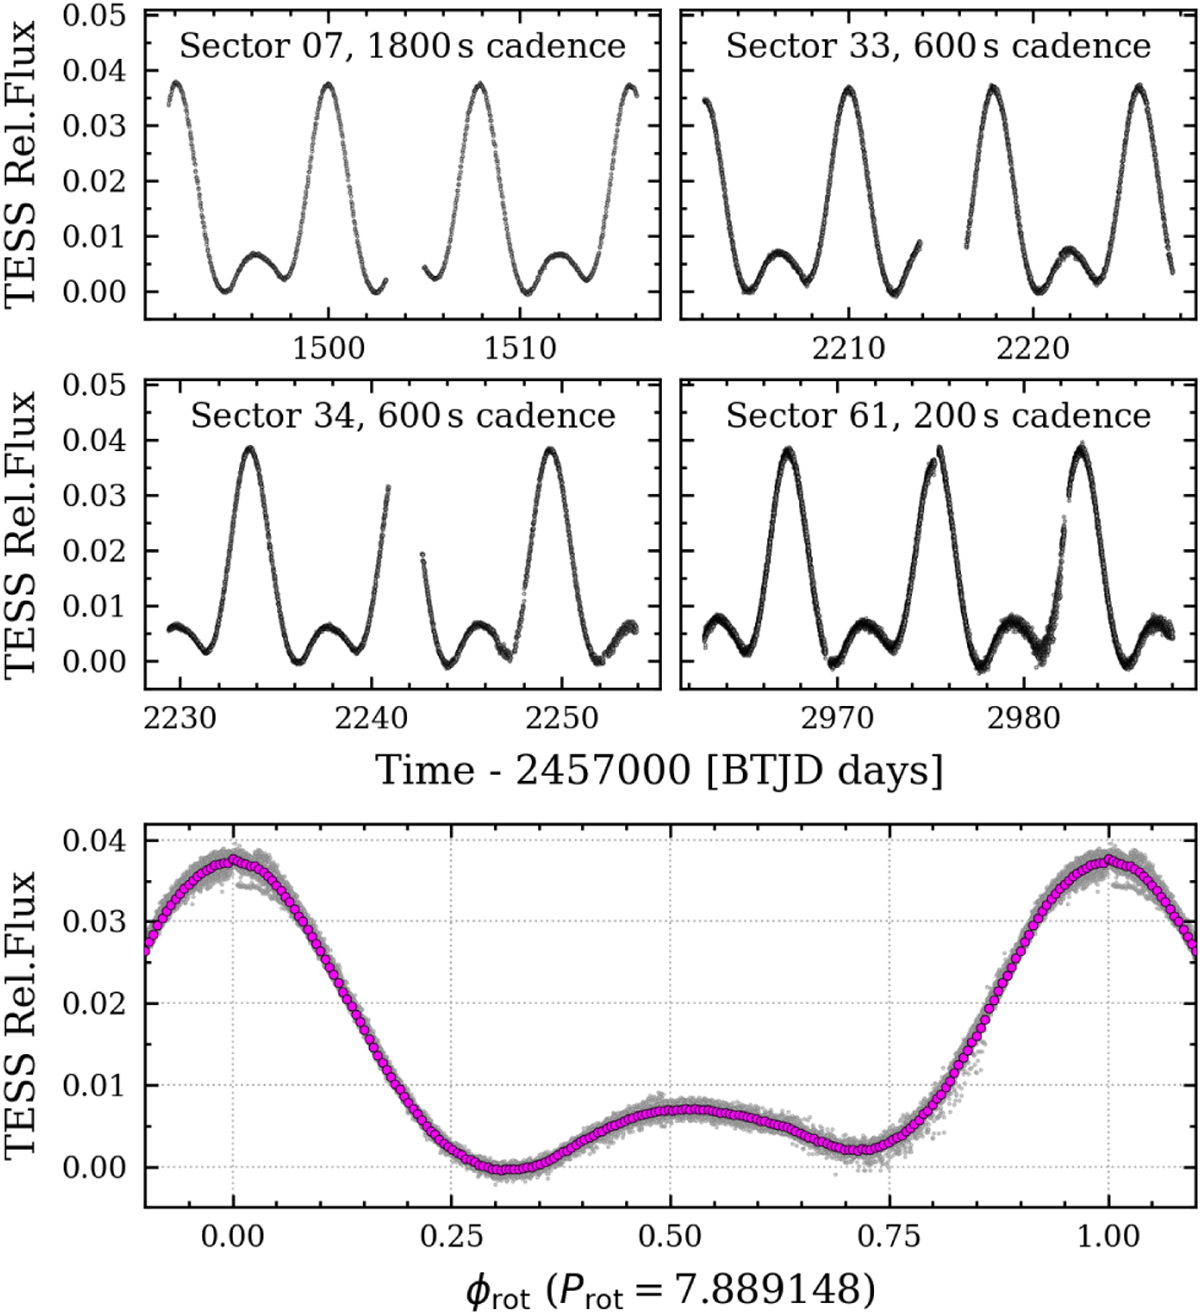
TESS light curve of HD 57372. The upper panels show the observed data from each of the four TESS sectors. The grey points in the lower panel are all of the data phased by the 7.889148 d rotation period and with 2458 492.07 as a reference epoch of maximum brightness. Magenta points show the data binned in increments of ϕrot = 0.005.
Current usage metrics show cumulative count of Article Views (full-text article views including HTML views, PDF and ePub downloads, according to the available data) and Abstracts Views on Vision4Press platform.
Data correspond to usage on the plateform after 2015. The current usage metrics is available 48-96 hours after online publication and is updated daily on week days.
Initial download of the metrics may take a while.