Fig. 8
Download original image
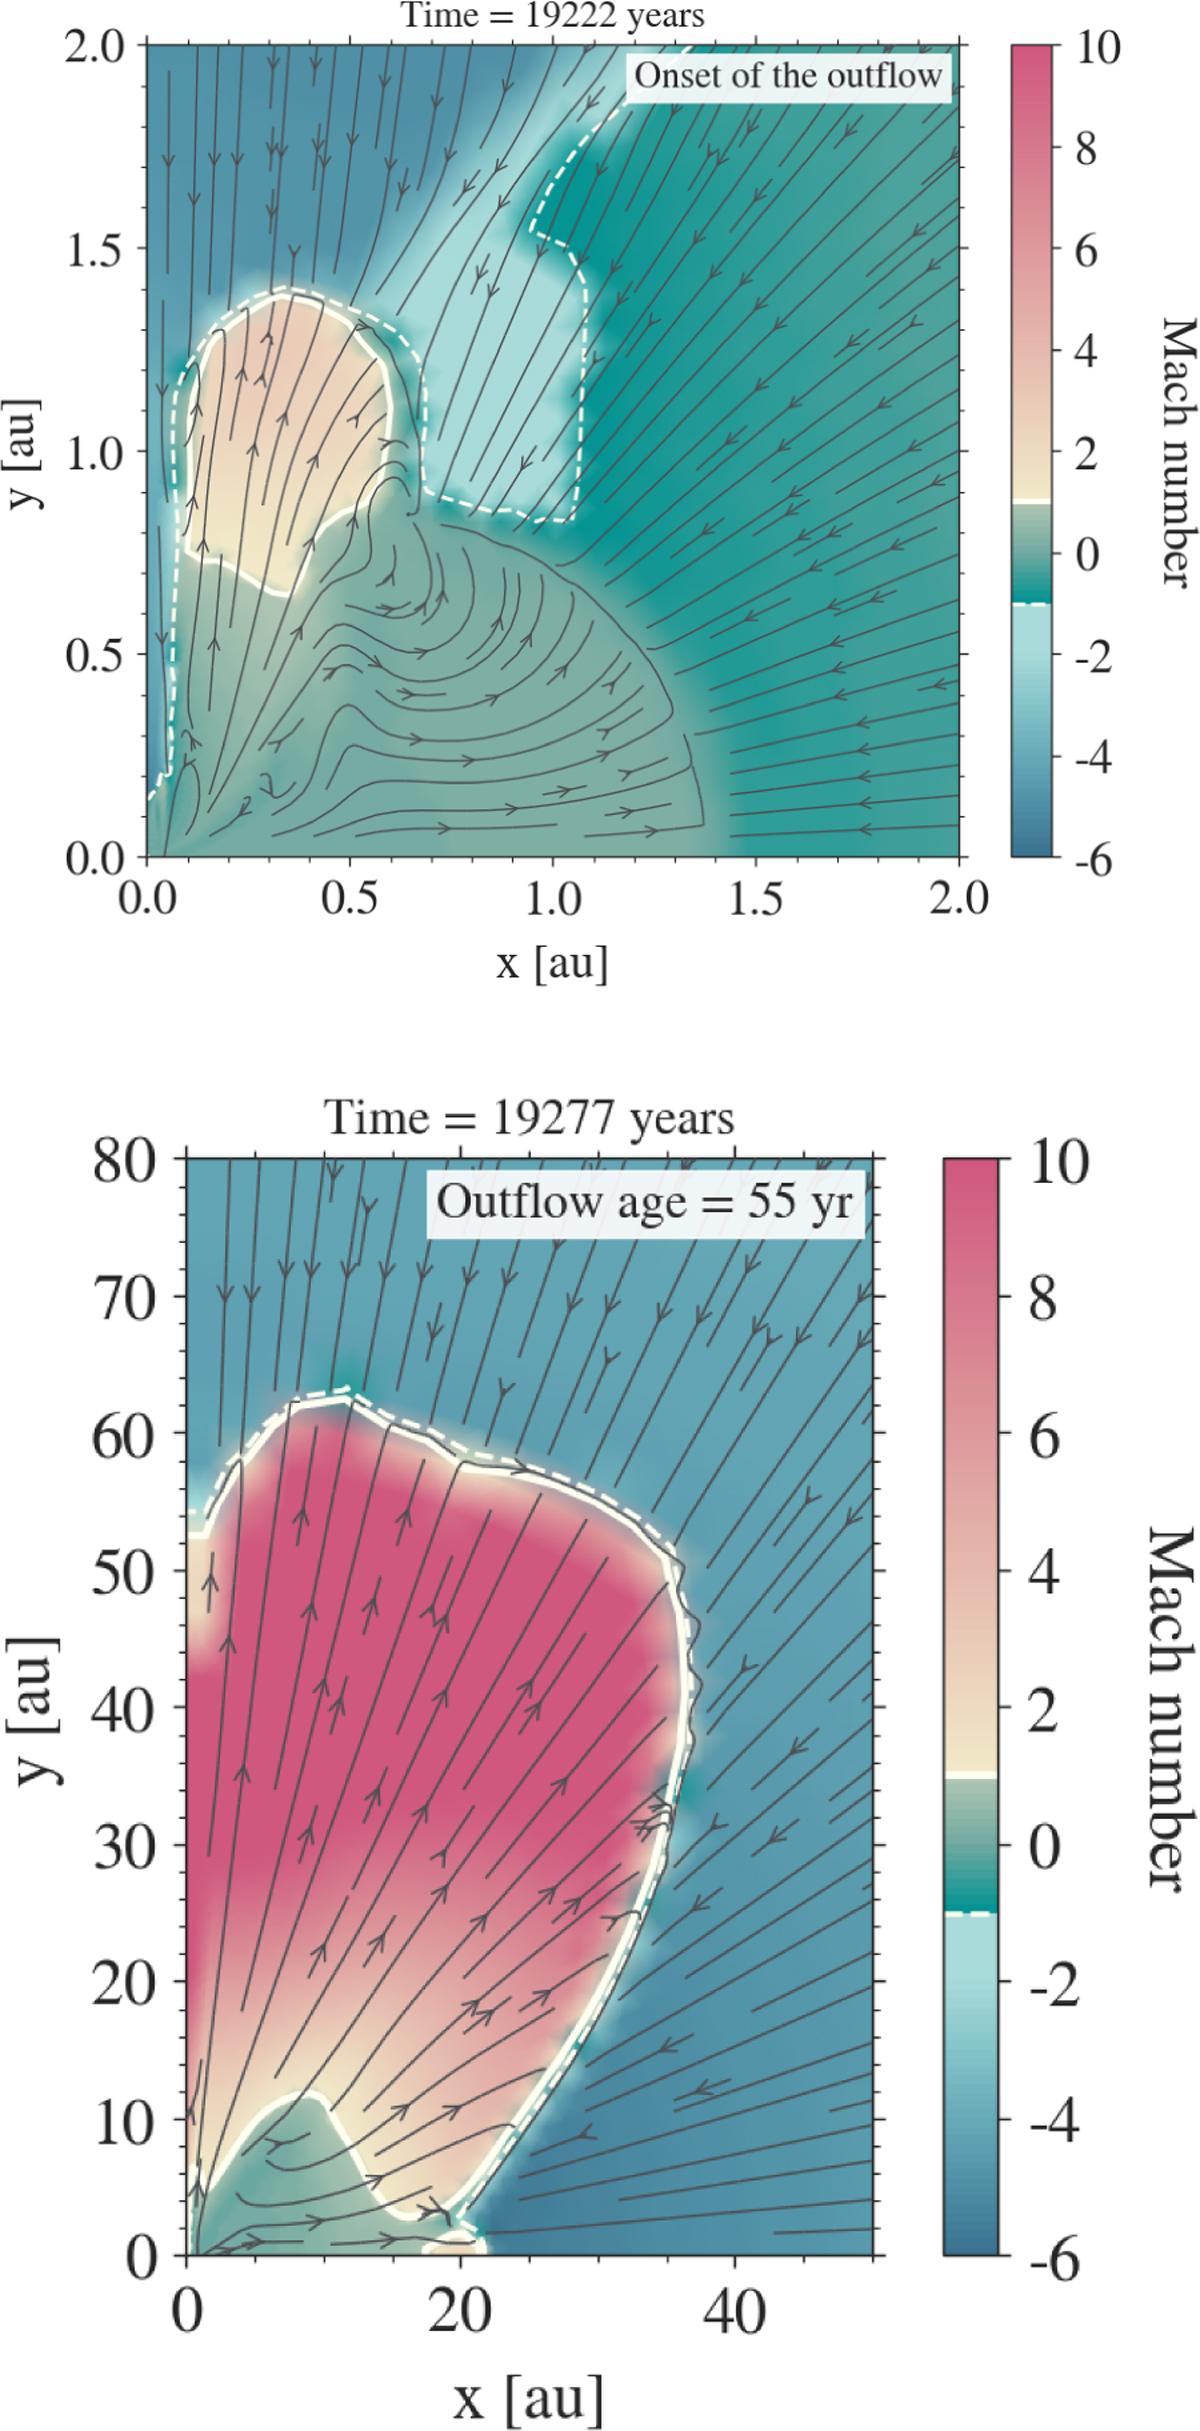
Radial Mach number (υr/cs) at first and last time snapshots of outflow formation during the 1 M⊙ pre-stellar core collapse. The gas velocity is indicated via the streamlines. The colour gradients in red and blue indicate the supersonic outflow and inflow regions, respectively. The colour gradient in green shows the subsonic regions mainly within the disc.
Current usage metrics show cumulative count of Article Views (full-text article views including HTML views, PDF and ePub downloads, according to the available data) and Abstracts Views on Vision4Press platform.
Data correspond to usage on the plateform after 2015. The current usage metrics is available 48-96 hours after online publication and is updated daily on week days.
Initial download of the metrics may take a while.