Fig. 21

Download original image
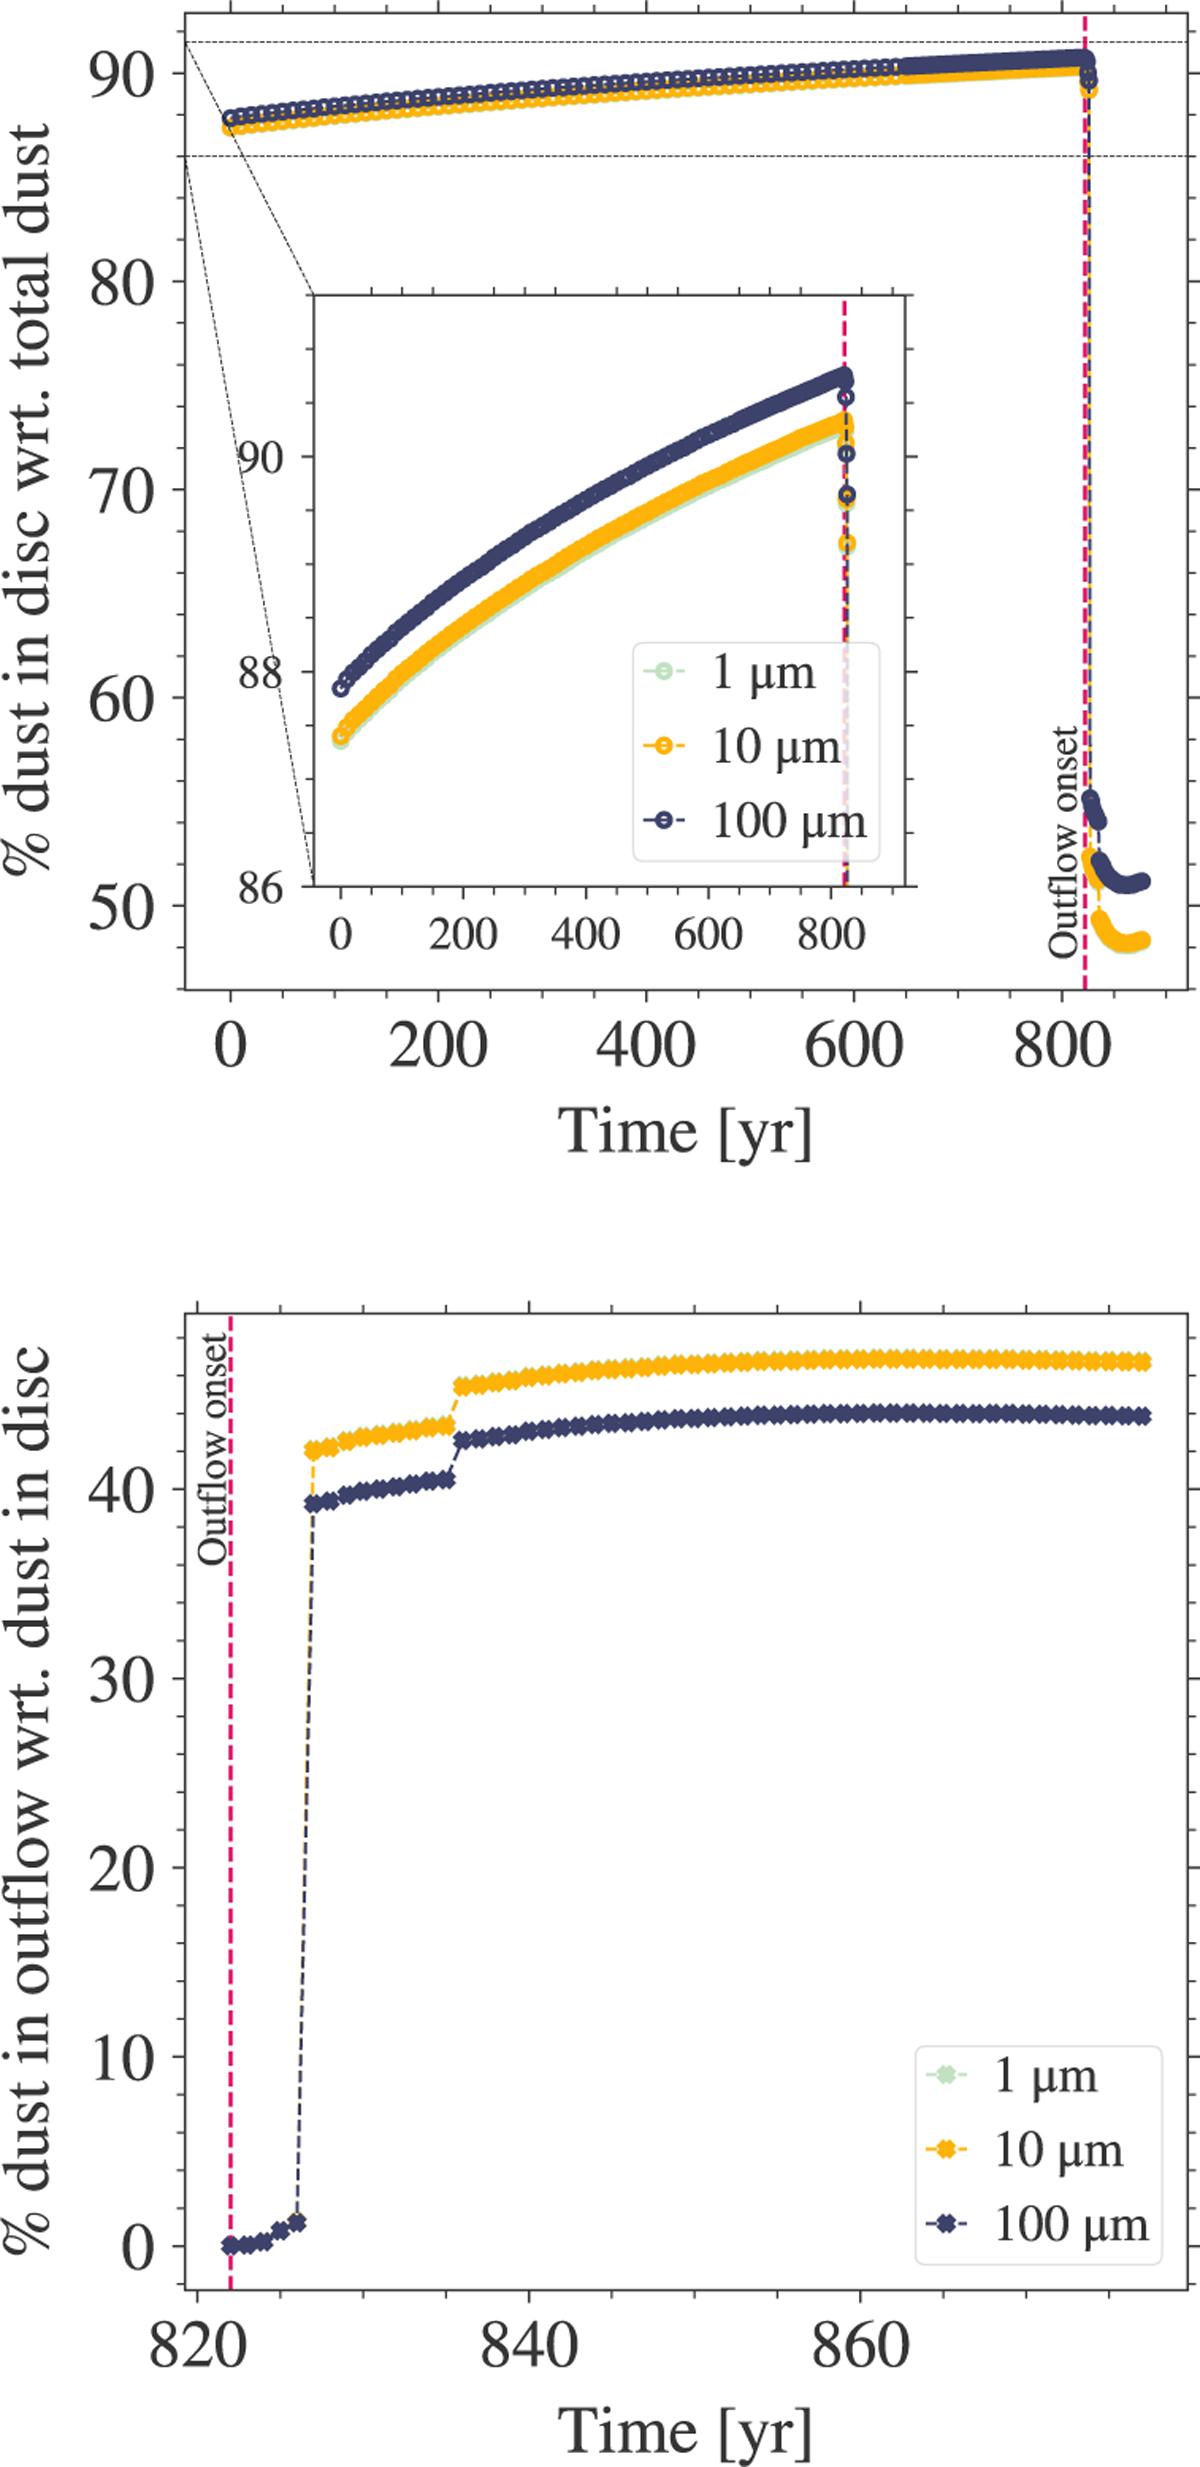
Fraction of dust particles within the disc and outflow over time with respect to its reservoir. Top: time evolution of the fraction of dust particles within the disc with respect to the total number of particles used in the simulation. Bottom: time evolution of the fraction of dust particles entrained in the outflow with respect to those present in the disc just before the outflow is launched. Time t = 0 indicates the beginning of transition of the first hydrostatic core into a rotationally supported disc formed during the collapse of a 1 M⊙ pre-stellar core. The vertical dashed magenta line marks the launch of the outflow.
Current usage metrics show cumulative count of Article Views (full-text article views including HTML views, PDF and ePub downloads, according to the available data) and Abstracts Views on Vision4Press platform.
Data correspond to usage on the plateform after 2015. The current usage metrics is available 48-96 hours after online publication and is updated daily on week days.
Initial download of the metrics may take a while.


