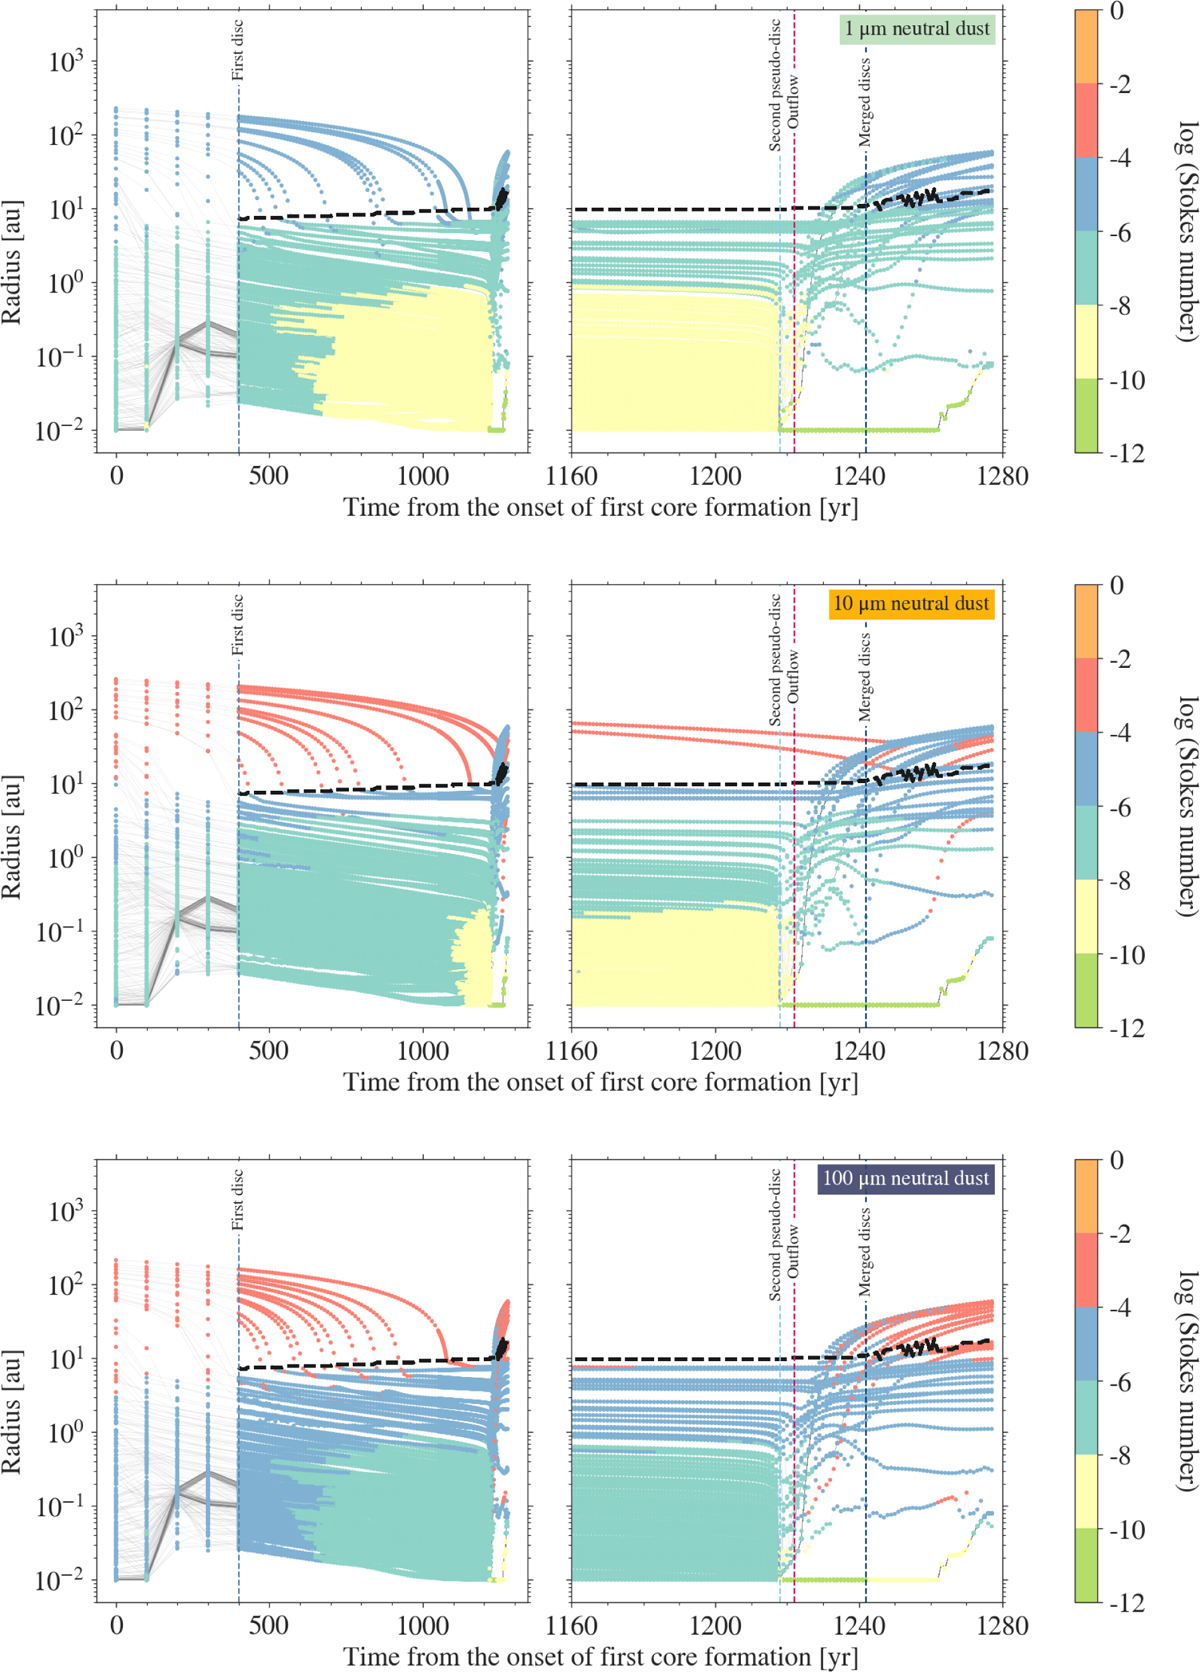
Fig. 18
Download original image
Tracks for a selected sample of 1 µm (top), 10 µm (middle), and 100 µm (bottom) dust that end up within the two discs during the 1 M⊙ pre-stellar core collapse. The colourmap shows the Stokes number, which changes as the fixed-size dust moves through different density regimes within the envelope, discs, and outflow. The vertical lines indicate the formation times of the two discs, and the outflow, and merger of the discs from the onset of the first core formation (t = 0). The horizontal dashed black line marks the first core disc or merged disc radius defined using the conditions listed in Sect. 3.1. A Stokes number much smaller than one throughout the evolution in all three plots indicates the size-independent coupling to the gas.
Current usage metrics show cumulative count of Article Views (full-text article views including HTML views, PDF and ePub downloads, according to the available data) and Abstracts Views on Vision4Press platform.
Data correspond to usage on the plateform after 2015. The current usage metrics is available 48-96 hours after online publication and is updated daily on week days.
Initial download of the metrics may take a while.