Fig. 16
Download original image
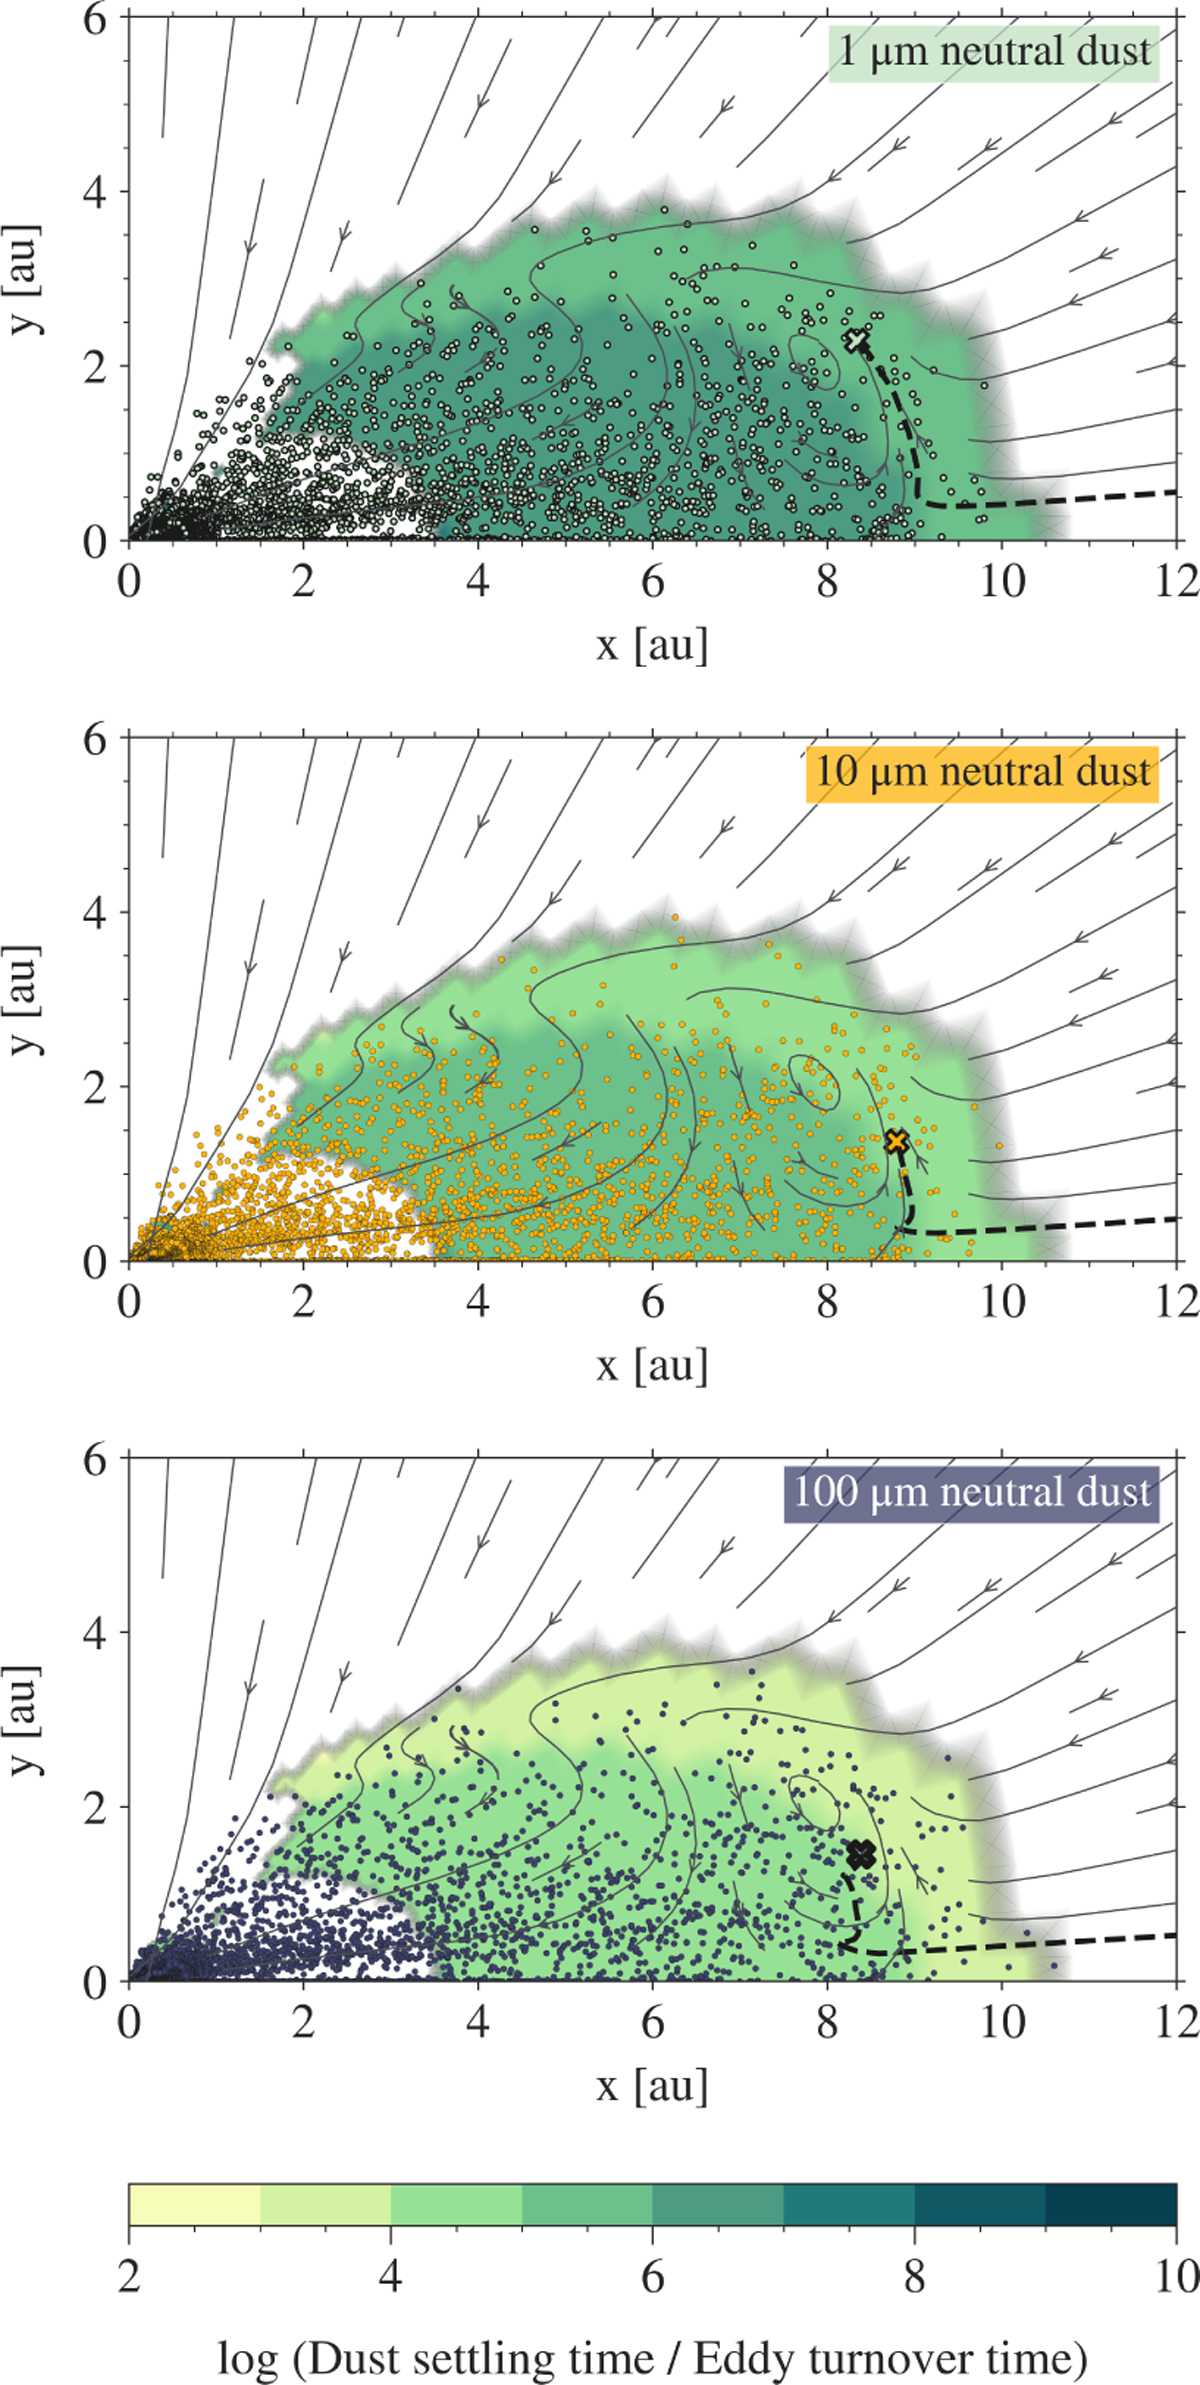
Ratio of dust settling to eddy turnover time only within the first core rotationally supported disc formed during the fiducial 1 M⊙ pre-stellar core collapse. The three plots highlight the behaviour of different dust sizes. Also overplotted is a single particle trajectory as a black dashed line for three different sizes of dust particles starting at the same initial grid cell location. The gas velocity streamlines indicate the material falling onto the disc and the deviation of gas and dust flow from a standard radial inward motion.
Current usage metrics show cumulative count of Article Views (full-text article views including HTML views, PDF and ePub downloads, according to the available data) and Abstracts Views on Vision4Press platform.
Data correspond to usage on the plateform after 2015. The current usage metrics is available 48-96 hours after online publication and is updated daily on week days.
Initial download of the metrics may take a while.