Fig. 8.
Download original image
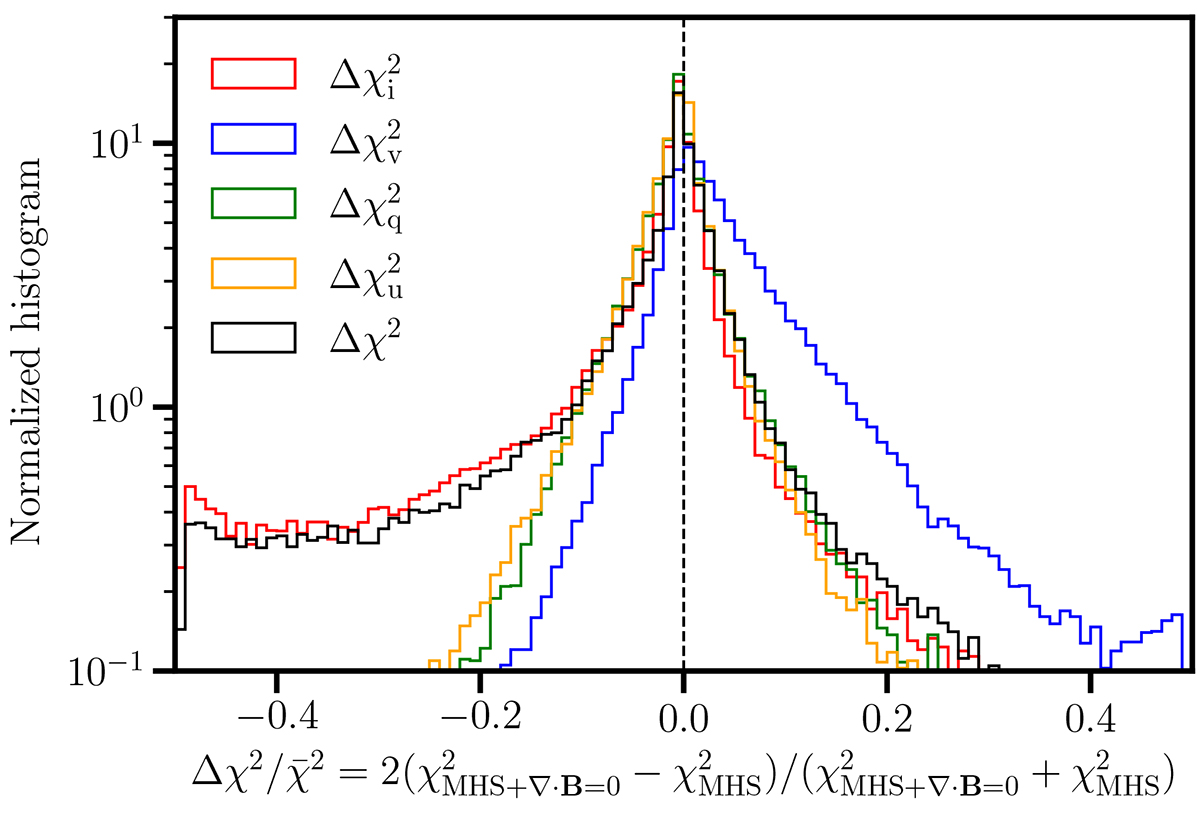
Histogram of the differences of the χ2 normalized to the average ![]() achieved by the MHS + ∇ ⋅ B = 0 inversion and by the MHS inversion. Color lines refer to Stokes I (red), Stokes V (blue), Stokes Q (green), Stokes U (orange), and all four Stokes parameters (black). Only pixels where Bh(log τc = −1.5) > 300 G are considered (see text for details).
achieved by the MHS + ∇ ⋅ B = 0 inversion and by the MHS inversion. Color lines refer to Stokes I (red), Stokes V (blue), Stokes Q (green), Stokes U (orange), and all four Stokes parameters (black). Only pixels where Bh(log τc = −1.5) > 300 G are considered (see text for details).
Current usage metrics show cumulative count of Article Views (full-text article views including HTML views, PDF and ePub downloads, according to the available data) and Abstracts Views on Vision4Press platform.
Data correspond to usage on the plateform after 2015. The current usage metrics is available 48-96 hours after online publication and is updated daily on week days.
Initial download of the metrics may take a while.