Fig. 7.
Download original image
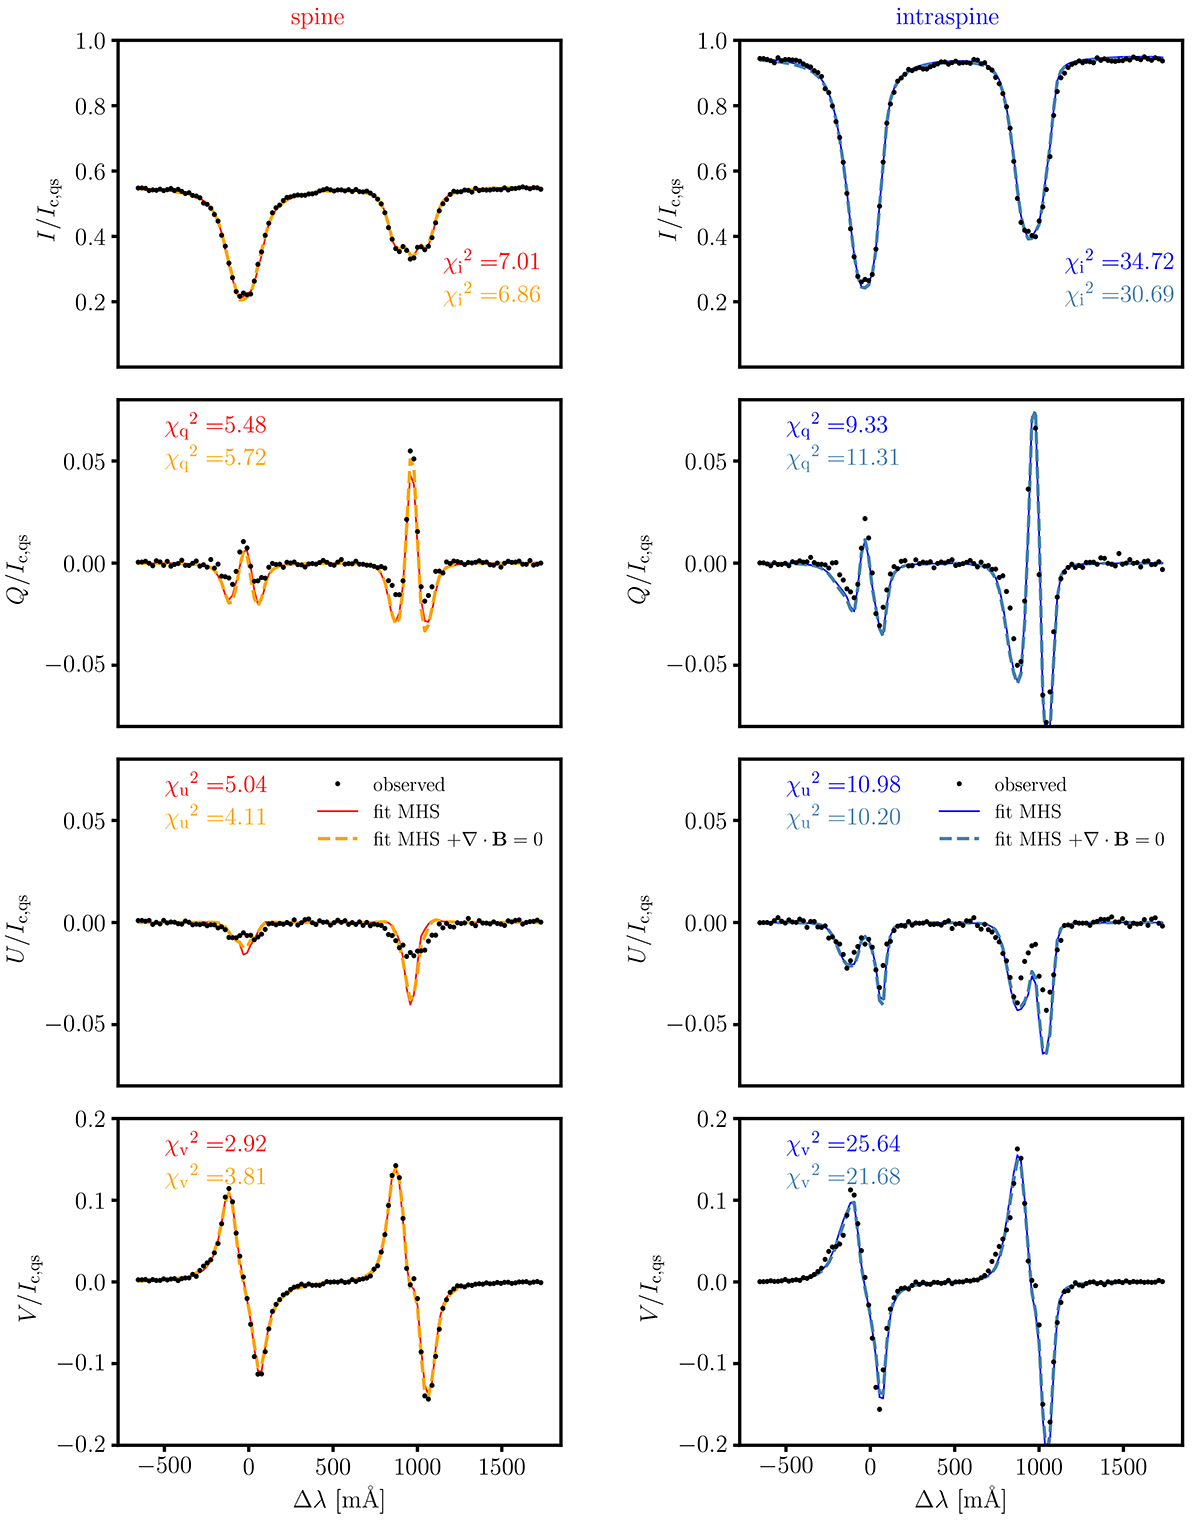
Comparison between observed and fitted Stokes profiles. Left panels: observations (black circles) and fits (color lines) at the location of the spine. Right panels: observations (black circles) and fits (color lines) at the location of the intraspine. From top to bottom: Stokes I, Q, U, and V. Solid color lines (red and blue) are the fits produced by the MHS inversion, whereas dashed color lines (orange and steel blue) correspond to the fits produced by the MHS ∇ ⋅ B = 0 inversion. The χ2 values for each case are also provided. The wavelength scale is given with respect to the first Fe I line at λ0 = 6301.5012 Å.
Current usage metrics show cumulative count of Article Views (full-text article views including HTML views, PDF and ePub downloads, according to the available data) and Abstracts Views on Vision4Press platform.
Data correspond to usage on the plateform after 2015. The current usage metrics is available 48-96 hours after online publication and is updated daily on week days.
Initial download of the metrics may take a while.