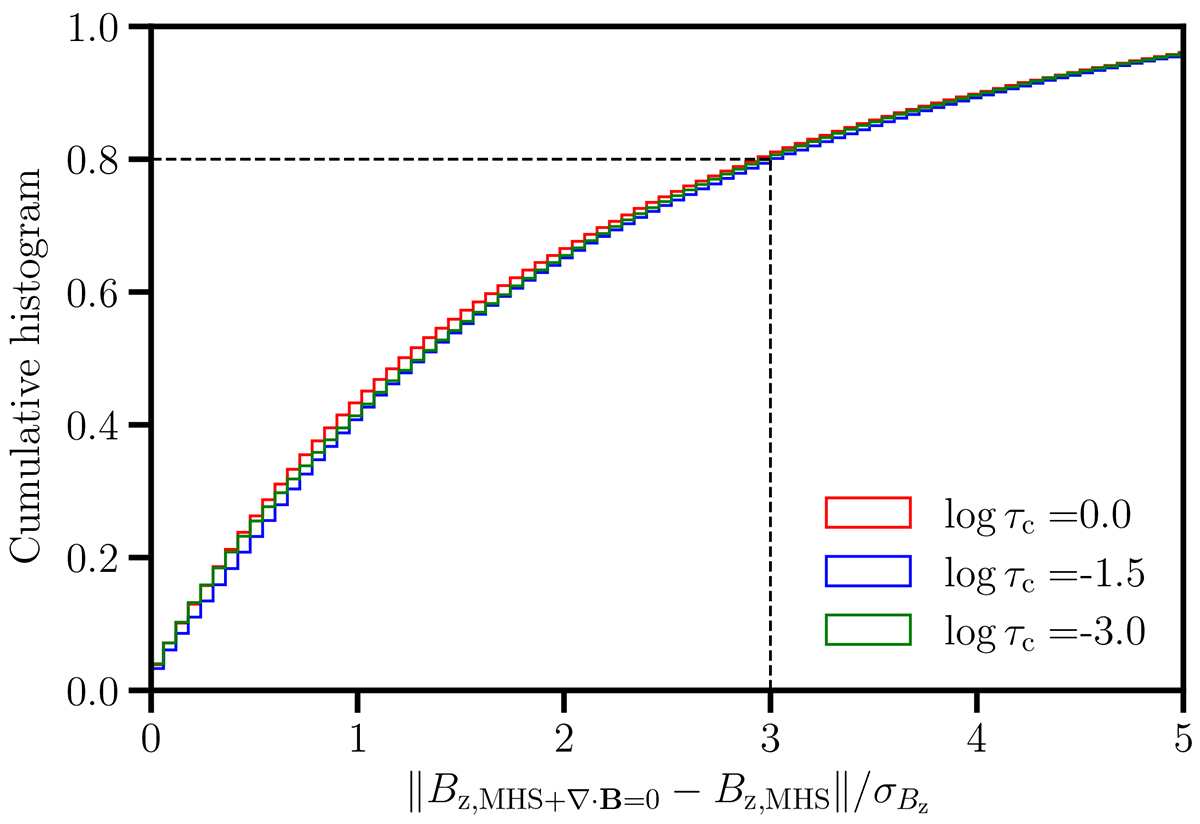
Fig. 6.
Download original image
Cumulative histogram of the number of pixels, shown at three different optical depth levels (red: log τc = 0; blue: log τc = −1.5; green: log τc = −3), as a function of the ratio of the difference between Bz obtained from both inversions to the standard deviation σBz. Only pixels where Bh(log τc = −1.5) > 300 G are considered (see text for details).
Current usage metrics show cumulative count of Article Views (full-text article views including HTML views, PDF and ePub downloads, according to the available data) and Abstracts Views on Vision4Press platform.
Data correspond to usage on the plateform after 2015. The current usage metrics is available 48-96 hours after online publication and is updated daily on week days.
Initial download of the metrics may take a while.