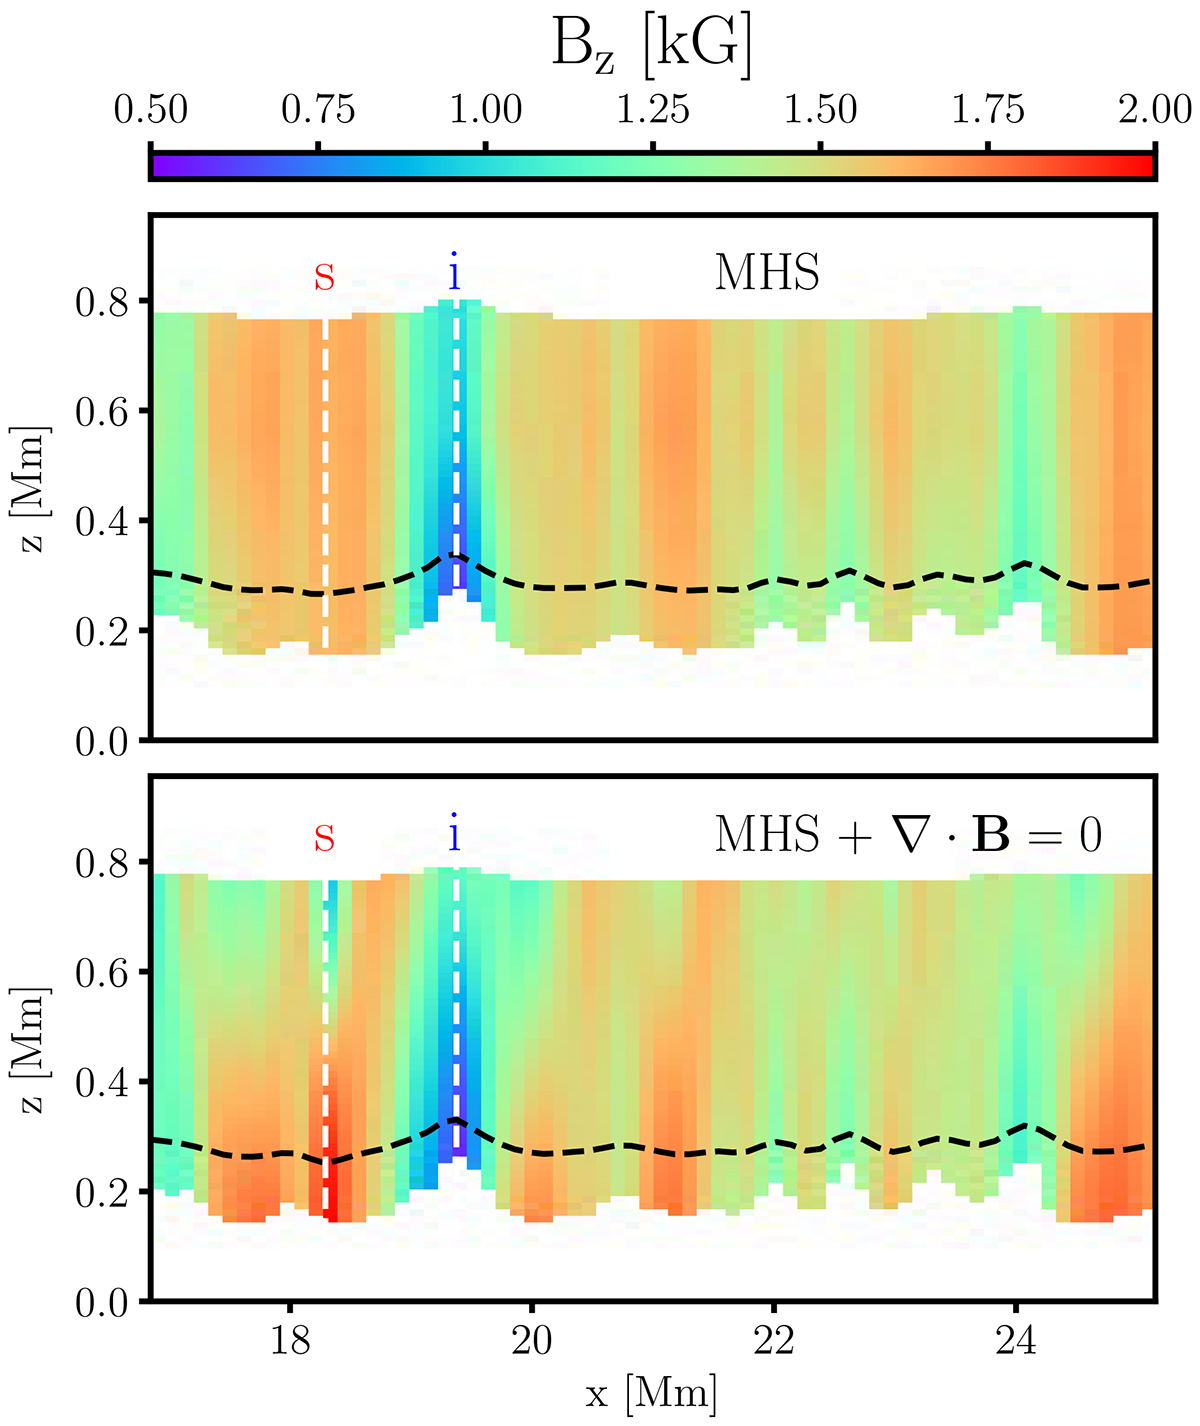
Fig. 4.
Download original image
Vertical component of the magnetic field, Bz(x, z), along the slice indicated by the red line in Fig. 1. Only regions between log τc ∈ [1, −4] (approximate region of sensitivity of the spectral lines observed by Hinode/SP) are shown. The dashed black line shows the location of the z(τc = 1) level (i.e., Wilson depression). Results from the MHS inversion are shown in the top panel, whereas results from the MHS + ∇ ⋅ B = 0 inversion are displayed in the bottom panel.
Current usage metrics show cumulative count of Article Views (full-text article views including HTML views, PDF and ePub downloads, according to the available data) and Abstracts Views on Vision4Press platform.
Data correspond to usage on the plateform after 2015. The current usage metrics is available 48-96 hours after online publication and is updated daily on week days.
Initial download of the metrics may take a while.