Open Access
Fig. 1.
Download original image
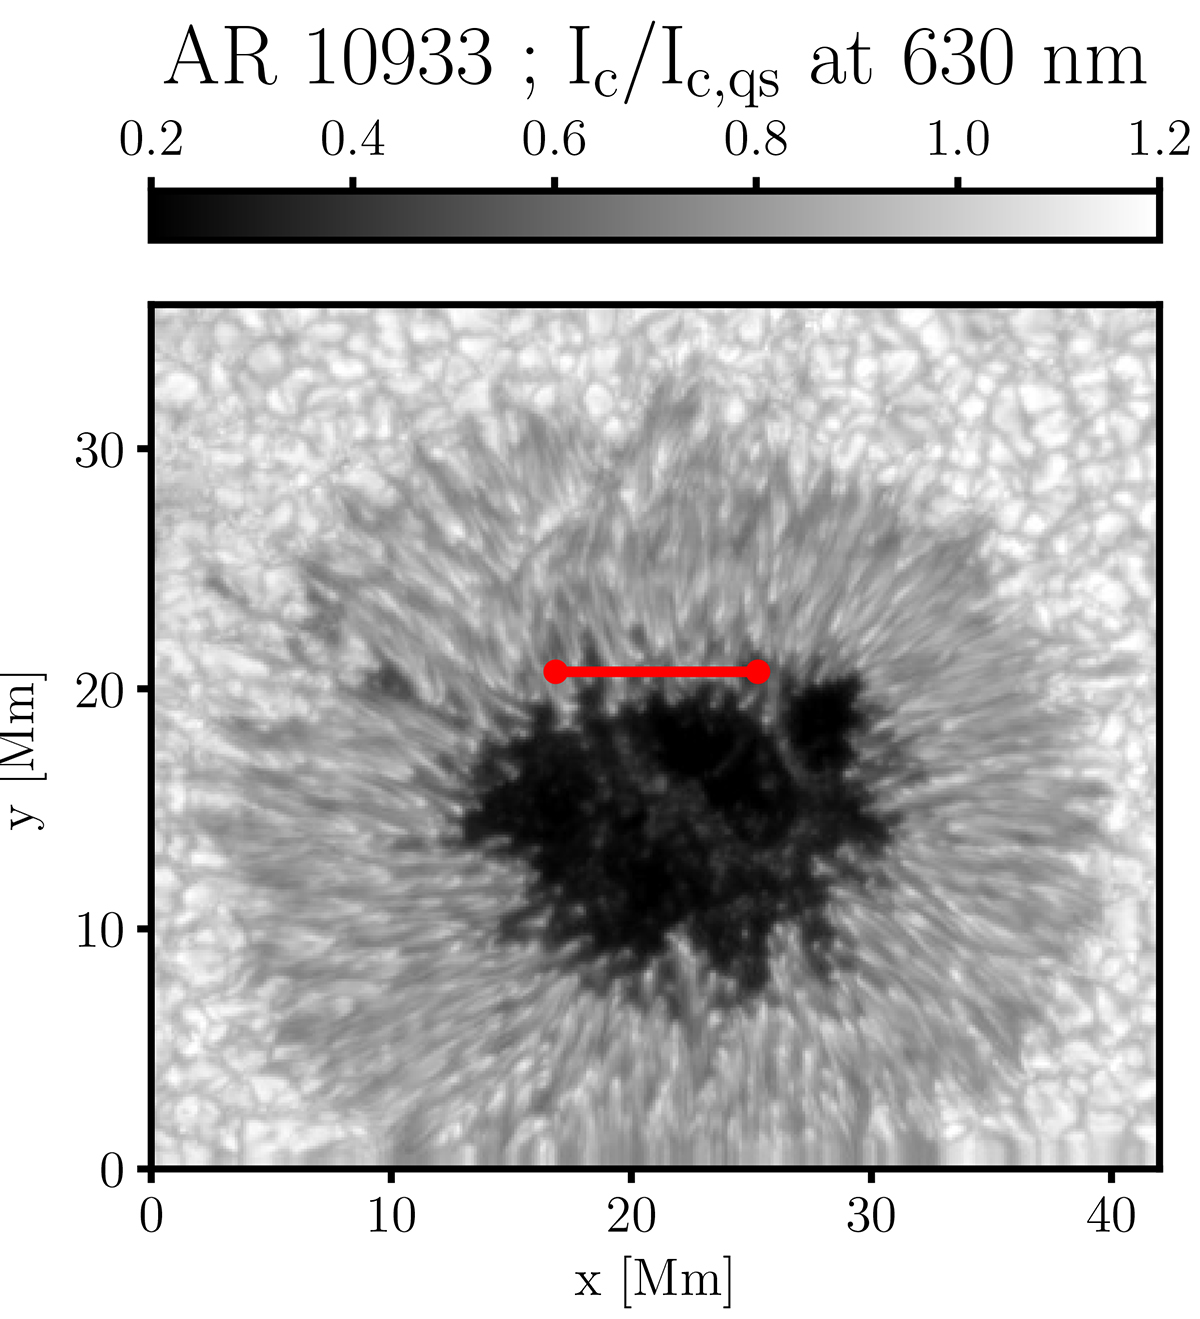
Map of the continuum intensity at 630 nm in AR 10933 observed at disk center on January 6, 2007, by SP on board the Hinode spacecraft. Physical parameters on the (x, z) slice indicated by the horizontal red line are studied in Sect. 3.
Current usage metrics show cumulative count of Article Views (full-text article views including HTML views, PDF and ePub downloads, according to the available data) and Abstracts Views on Vision4Press platform.
Data correspond to usage on the plateform after 2015. The current usage metrics is available 48-96 hours after online publication and is updated daily on week days.
Initial download of the metrics may take a while.