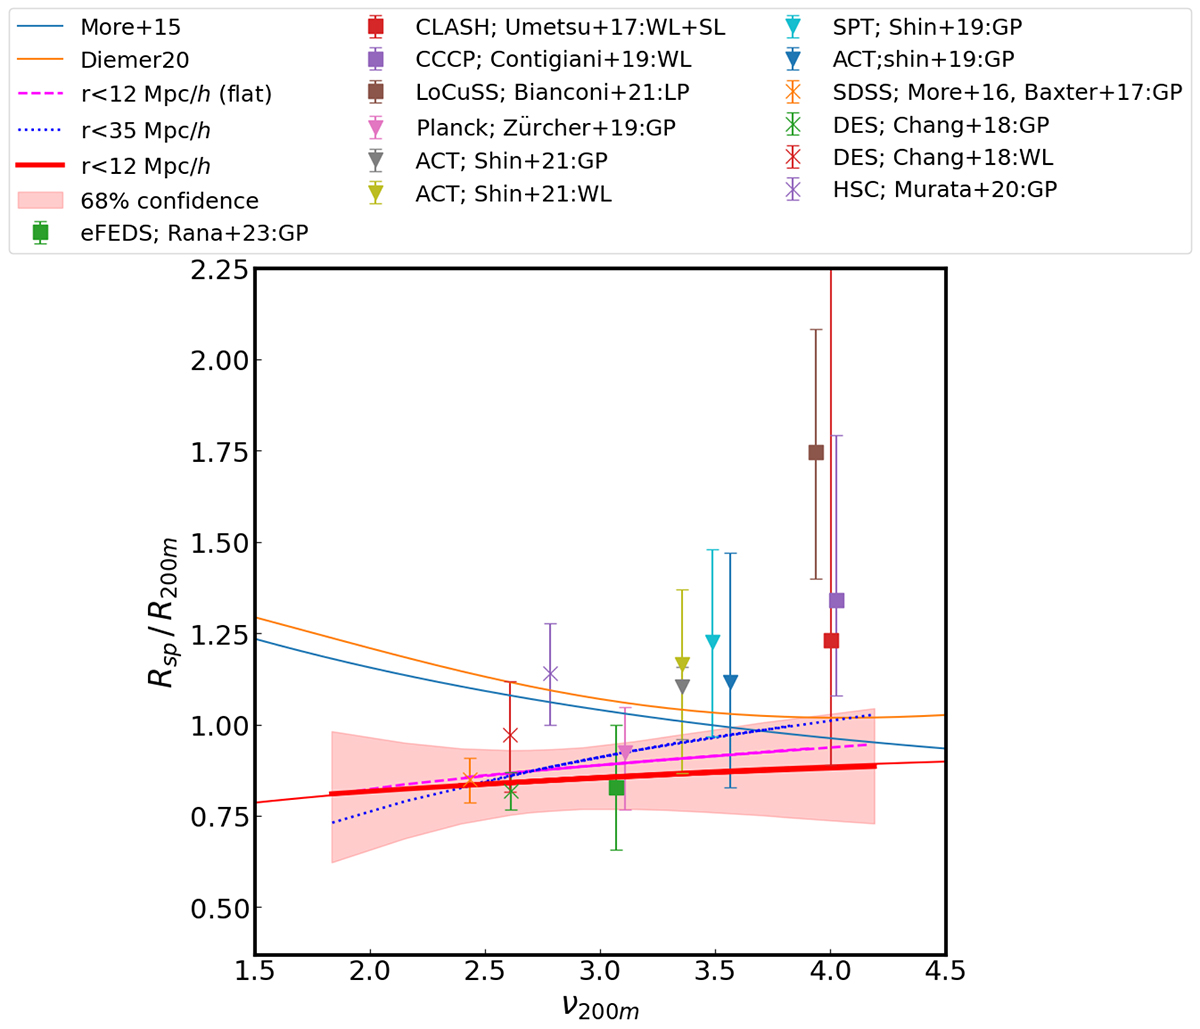
Fig. 9.
Download original image
Rescaled splashback radius as a function of the cluster peak height. The red solid curve and the corresponding shaded region represent the result of our reference fitting procedure model. The blue and orange curves correspond to the model predictions by More et al. (2015) and Diemer (2020), respectively. The different data points represent the relation measured by different authors, using various selected galaxy cluster samples and observables: galaxy projected correlation function (GP), weak lensing (WL), and in combination of weak and strong lensing (WL+SL) and stacked luminosity profiles (LP). X-ray, SZ and optically selected clusters are displayed using squares, triangles and crosses.
Current usage metrics show cumulative count of Article Views (full-text article views including HTML views, PDF and ePub downloads, according to the available data) and Abstracts Views on Vision4Press platform.
Data correspond to usage on the plateform after 2015. The current usage metrics is available 48-96 hours after online publication and is updated daily on week days.
Initial download of the metrics may take a while.