Fig. 5.
Download original image
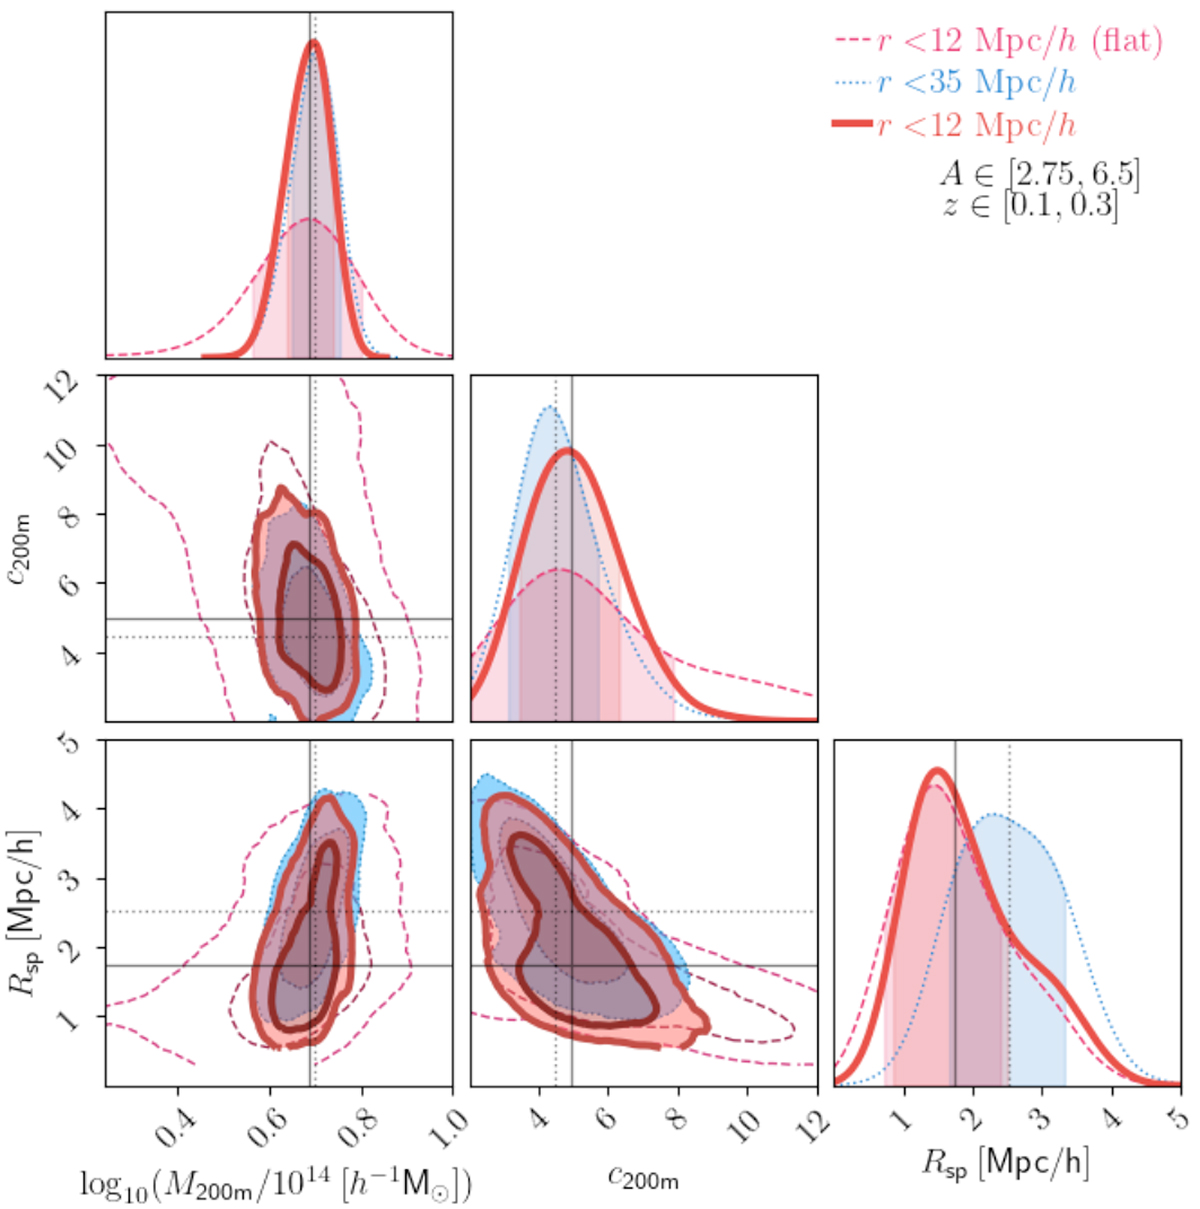
Posteriors distributions of the recovered mass concentration c200m and splashback radius Rsp, modelling the black filled circles as in Fig. 1, corresponding the same stacked cluster sample as in Fig. 2. The red solid distribution shows our reference result that is modelling the data up to 12 Mpc/h and adopting Gaussian priors for both the logarithm of the mass and the concentration. The blue-dotted distributions have been obtained modelling the data up to 35 Mpc/h, while the magenta dashed refers to the case in which we assume flat priors for log10(M200m) and c200m.
Current usage metrics show cumulative count of Article Views (full-text article views including HTML views, PDF and ePub downloads, according to the available data) and Abstracts Views on Vision4Press platform.
Data correspond to usage on the plateform after 2015. The current usage metrics is available 48-96 hours after online publication and is updated daily on week days.
Initial download of the metrics may take a while.