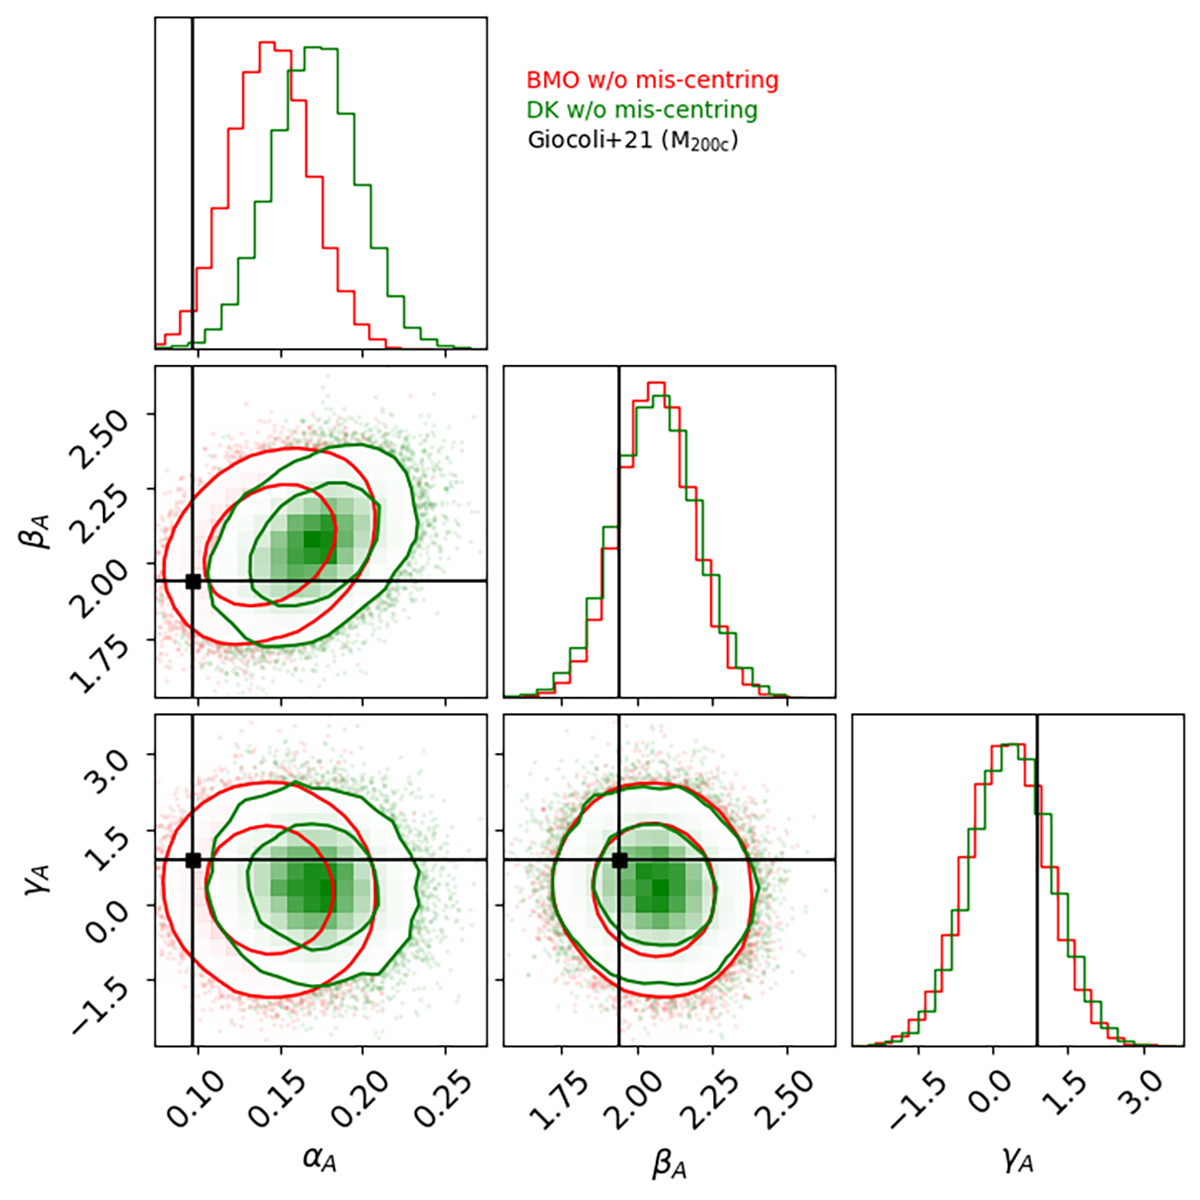
Fig. 4.
Download original image
Posterior distributions of the parameters of the mass-amplitude relation as in Eq. (19). The contours show the 1 and 2σ confidence regions of the distributions for the BMO (red) and DK14 (green), both without accounting for the mis-centring of clusters. In Table 3, we report the median values with the corresponding 16th and 85th percentiles for all cases. The black points indicate the median of the posteriors derived by Giocoli et al. (2021) when considering the mis-centring terms and the BMO model in deriving M200c.
Current usage metrics show cumulative count of Article Views (full-text article views including HTML views, PDF and ePub downloads, according to the available data) and Abstracts Views on Vision4Press platform.
Data correspond to usage on the plateform after 2015. The current usage metrics is available 48-96 hours after online publication and is updated daily on week days.
Initial download of the metrics may take a while.