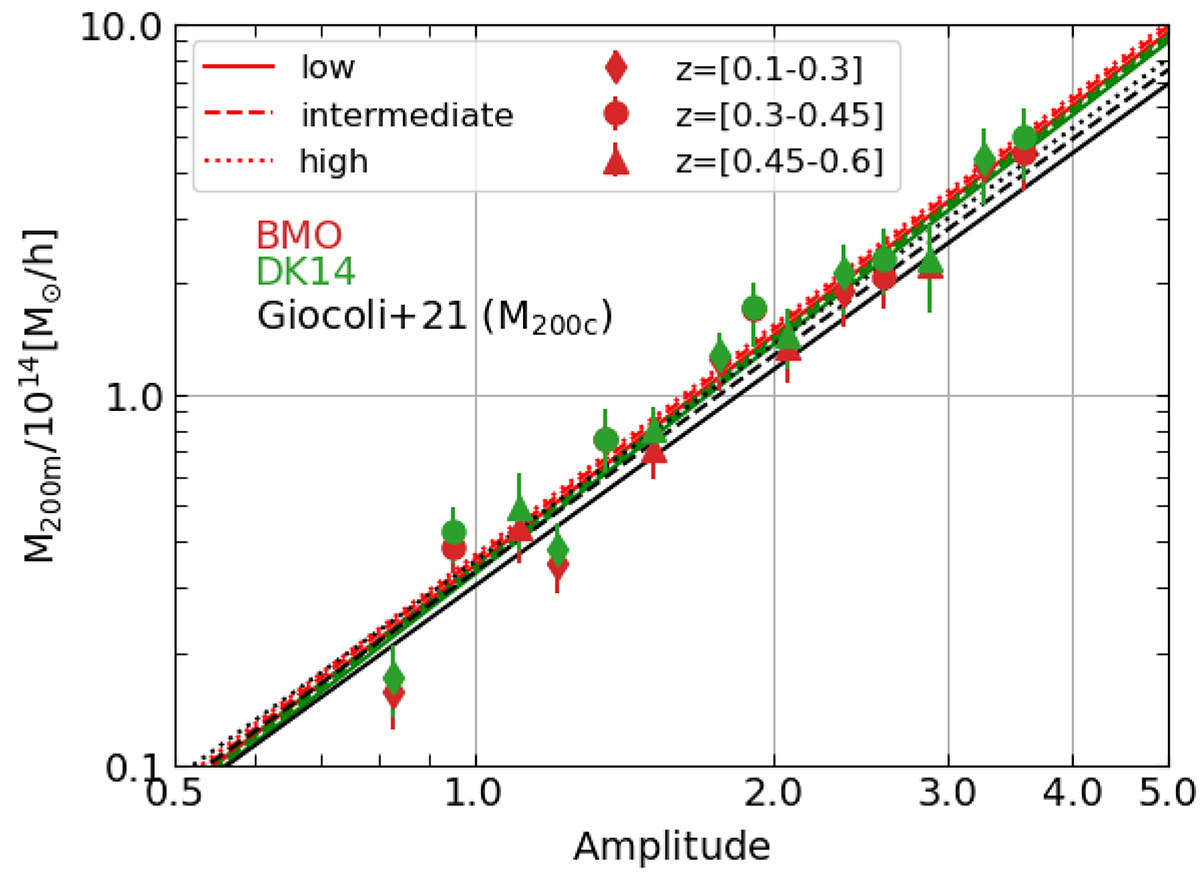
Fig. 3.
Download original image
Mass-amplitude relation calibrated using BMO and DK14 without accounting for the mis-centring uncertainties. The data points and the corresponding error bars exhibit the median and the 16th and 84th percentiles of the posterior log10(M200m) distributions. The corresponding coloured lines show the best-fit scaling relations in the three redshift bins. For comparison purposes, the black lines show the results by Giocoli et al. (2021) adopting a different overdensity mass definition M200c.
Current usage metrics show cumulative count of Article Views (full-text article views including HTML views, PDF and ePub downloads, according to the available data) and Abstracts Views on Vision4Press platform.
Data correspond to usage on the plateform after 2015. The current usage metrics is available 48-96 hours after online publication and is updated daily on week days.
Initial download of the metrics may take a while.