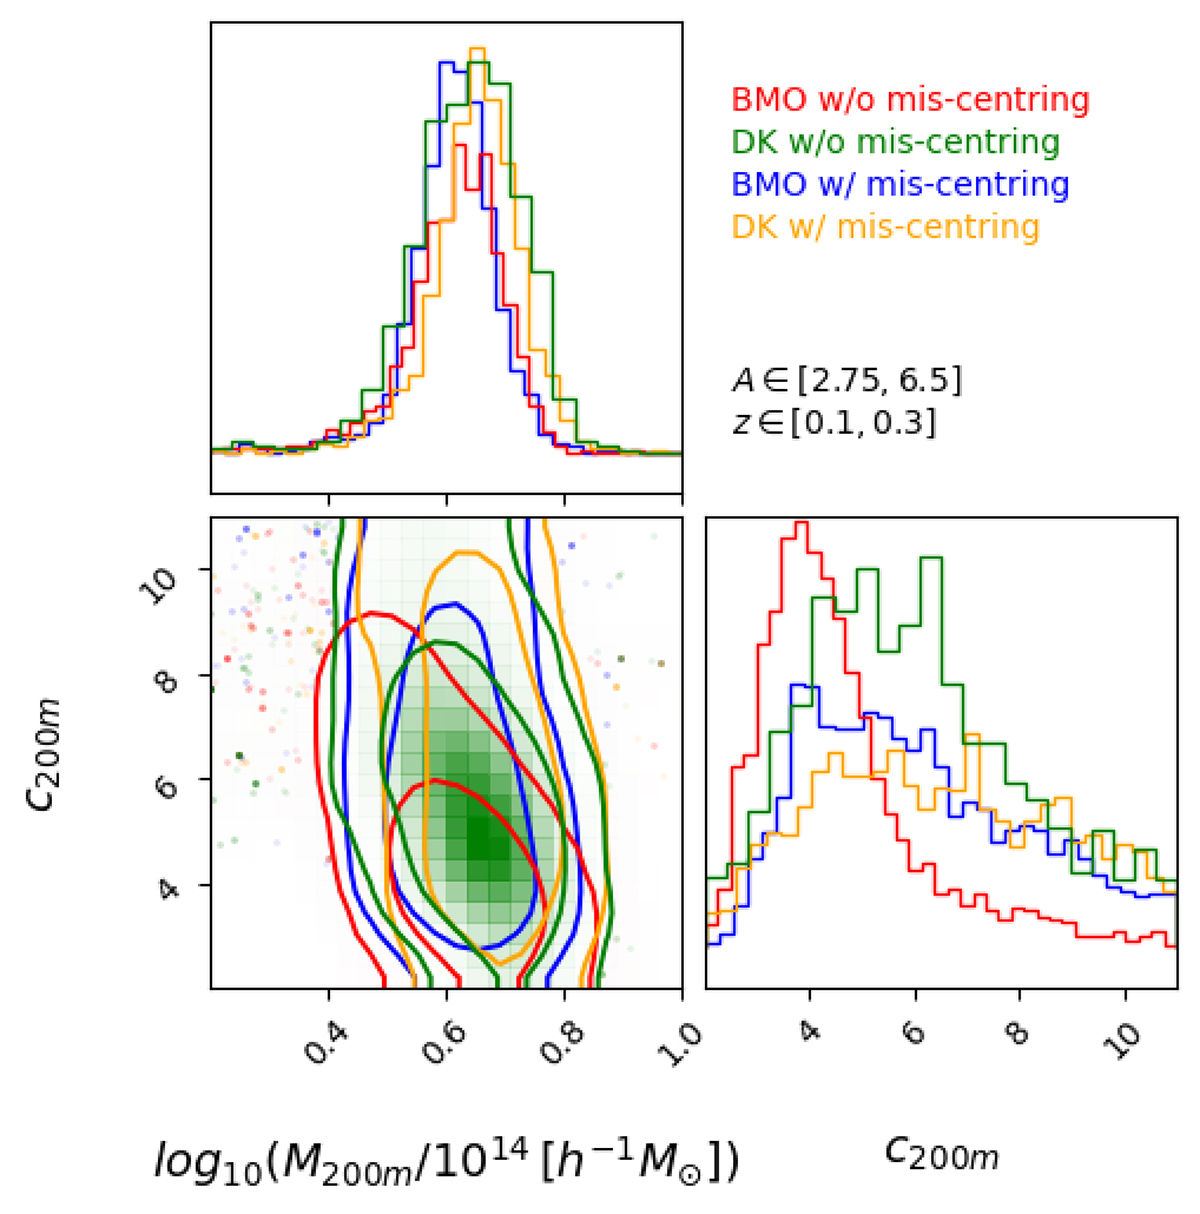
Fig. 2.
Download original image
Posteriors distribution in the recovered mass log10(M200m) and concentration c200m when modelling the cluster data, the magenta crosses in Fig. 1 for the top right case corresponding to the first redshift bin and to the last amplitude bin. Red (green) and blue (orange) distributions show the posteriors of the recovered mass and concentration using the BMO (DK14) model without and with the mis-centring uncertainty distributions, respectively.
Current usage metrics show cumulative count of Article Views (full-text article views including HTML views, PDF and ePub downloads, according to the available data) and Abstracts Views on Vision4Press platform.
Data correspond to usage on the plateform after 2015. The current usage metrics is available 48-96 hours after online publication and is updated daily on week days.
Initial download of the metrics may take a while.