Fig. 1.
Download original image
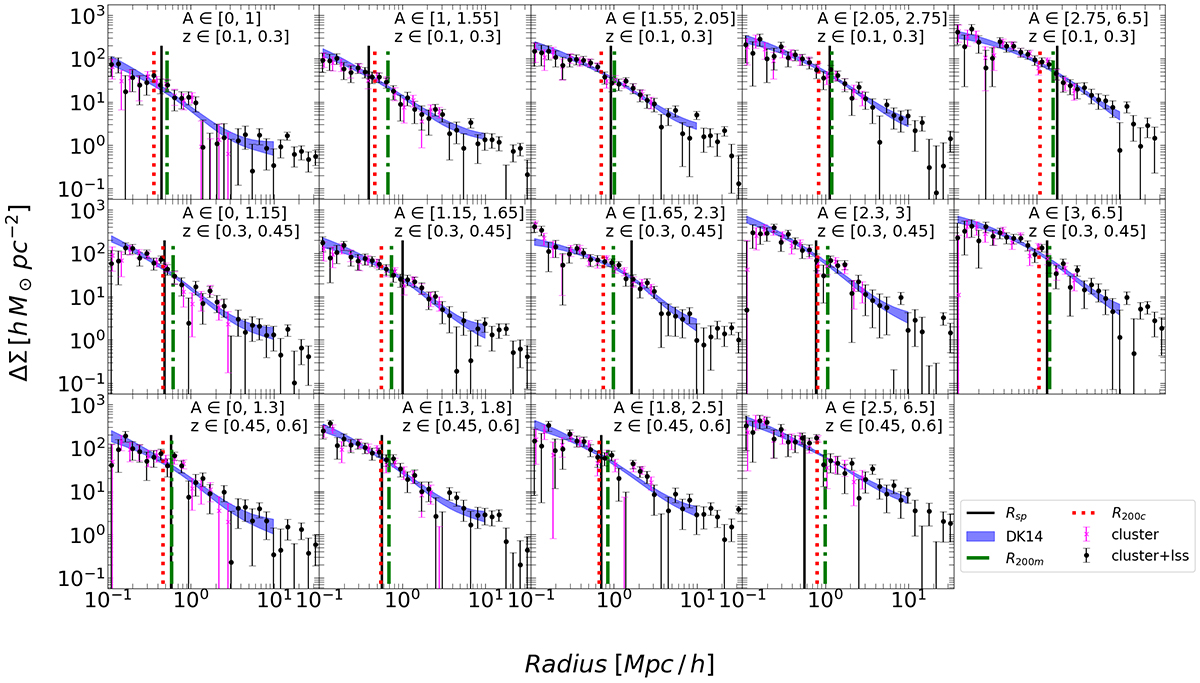
Excess surface mass density data and models. The data points, with the corresponding error bars, represent the stacked measurements in different amplitude and redshift bins, as labelled in each panel. Magenta crosses and black-filled circles refer to the expected signals from the cluster region and from the cluster plus the large-scale structure (lss) contributions, respectively. In the latter case, we also subtract the signal around 10 000 random realisations of the cluster sample. Blue-shaded regions enclose the 16th and 84th percentiles of the best-fit model, adopting DK14 (Diemer & Kravtsov 2014), to the black data points up to 12 h−1Mpc. The red-dotted, green-dashed and black solid vertical lines mark the location of different cluster radii: R200c, R200mm and the splashback radius Rsp, respectively.
Current usage metrics show cumulative count of Article Views (full-text article views including HTML views, PDF and ePub downloads, according to the available data) and Abstracts Views on Vision4Press platform.
Data correspond to usage on the plateform after 2015. The current usage metrics is available 48-96 hours after online publication and is updated daily on week days.
Initial download of the metrics may take a while.