Open Access
Fig. 3
Download original image
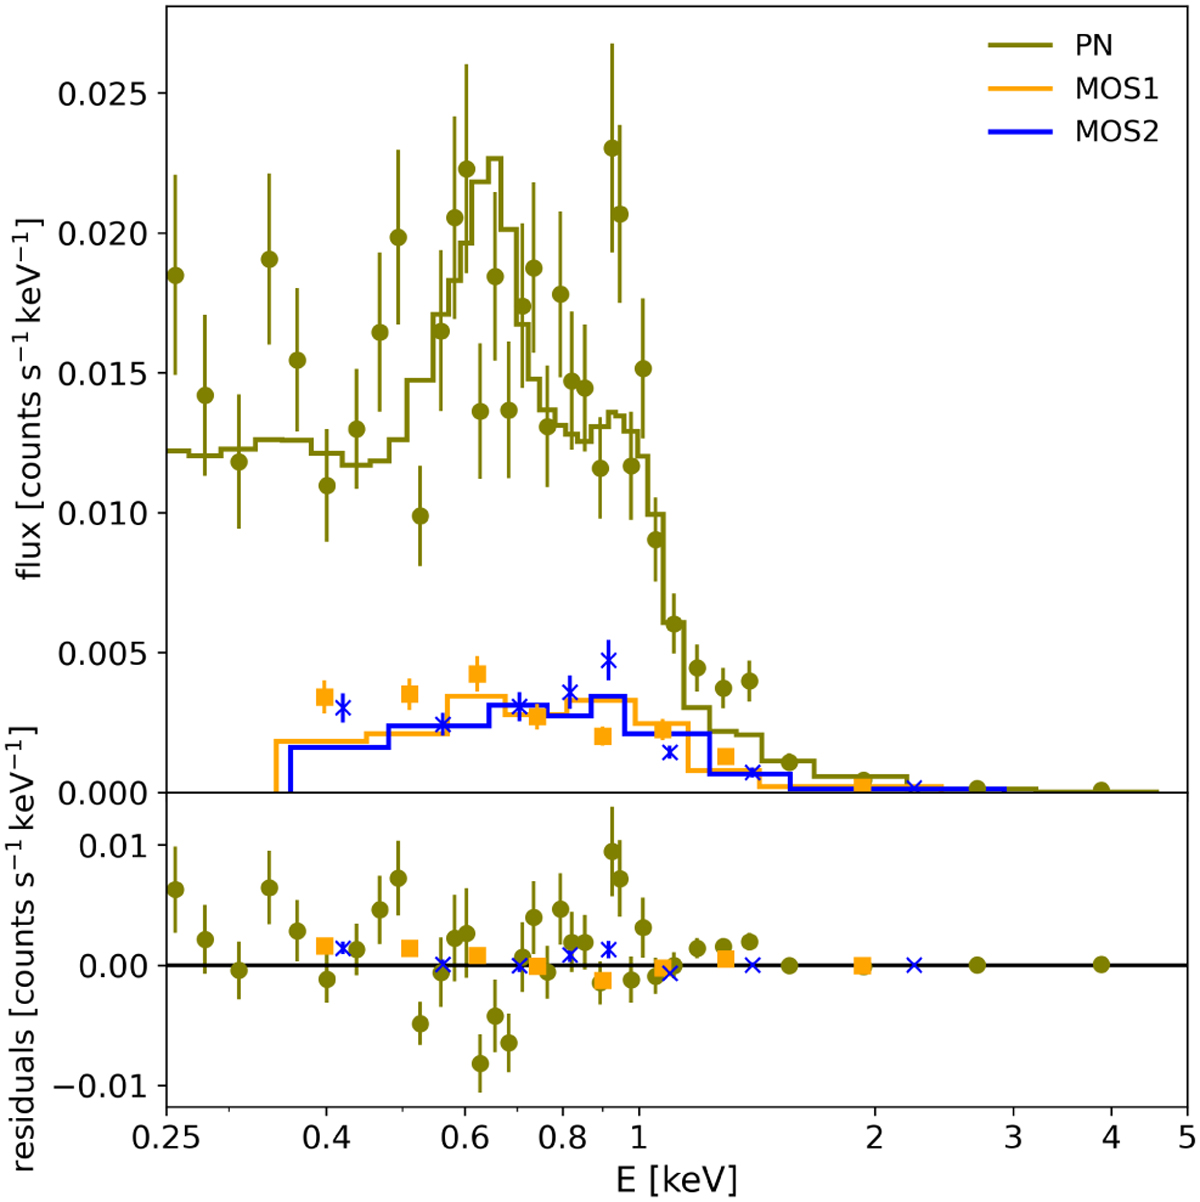
Time-averaged XMM-Newton EPIC spectra. The top panel shows the spectra taken with the different EPIC instruments (data points with error bars) together with the best-fit two-temperature VAPEC model with Fe/O = 0.6 for the full data set (solid lines). The bottom panel shows the residuals to the fit.
Current usage metrics show cumulative count of Article Views (full-text article views including HTML views, PDF and ePub downloads, according to the available data) and Abstracts Views on Vision4Press platform.
Data correspond to usage on the plateform after 2015. The current usage metrics is available 48-96 hours after online publication and is updated daily on week days.
Initial download of the metrics may take a while.