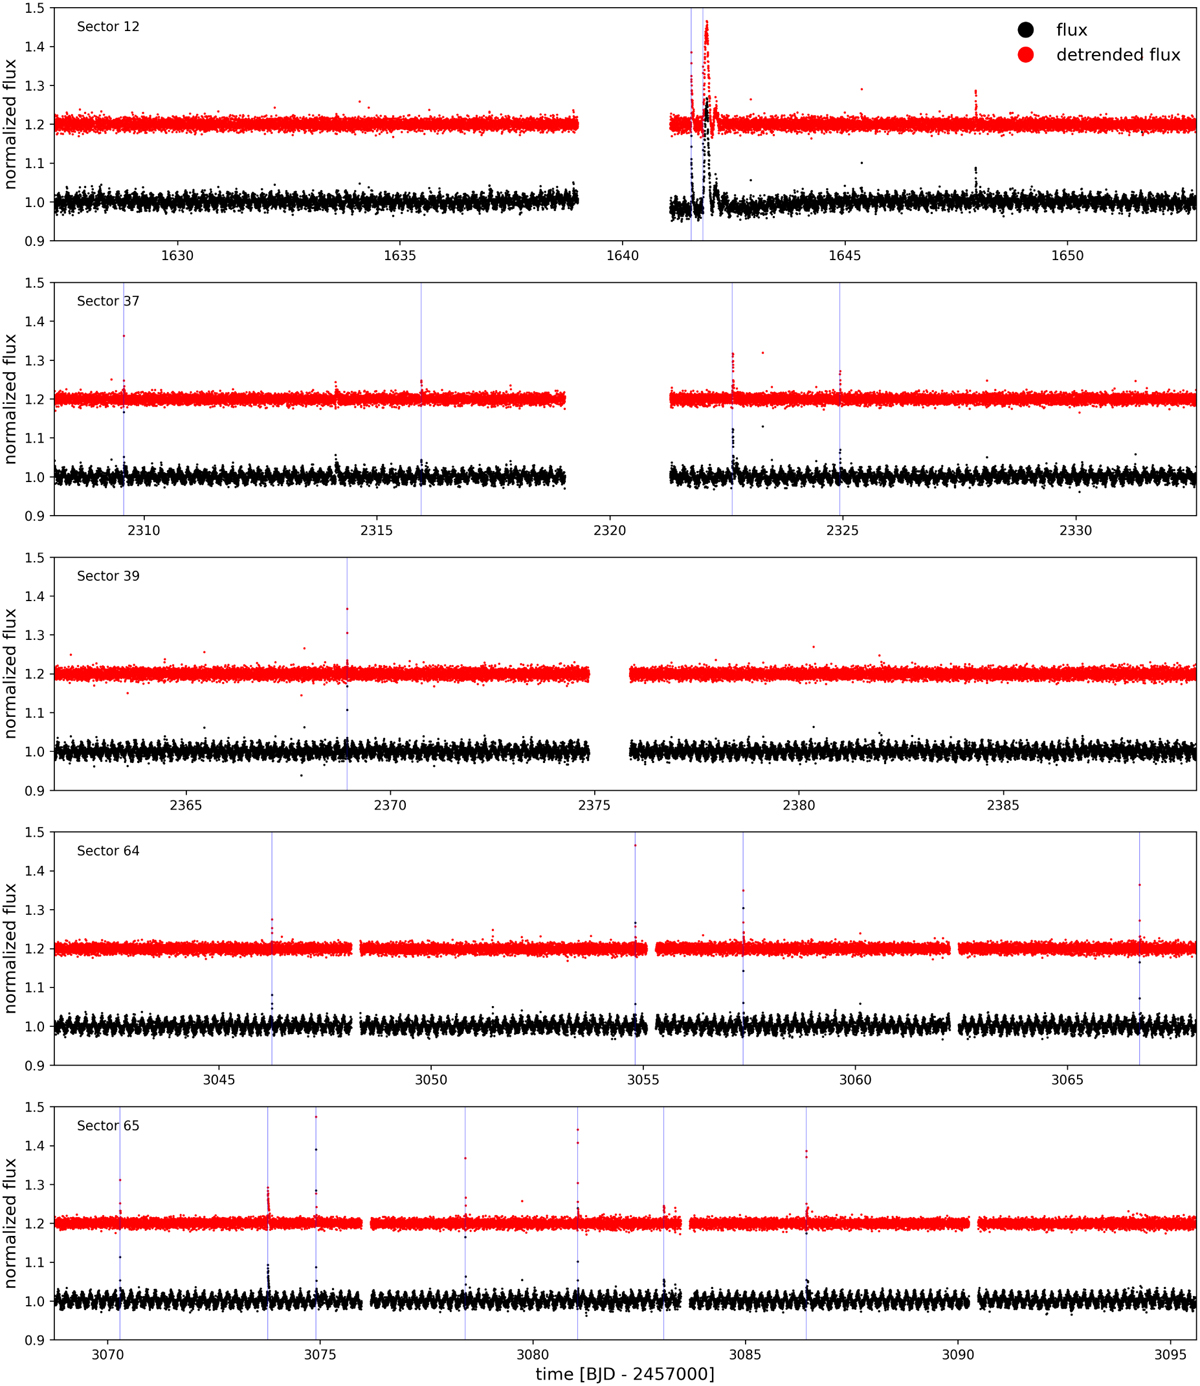
Fig. 2
Download original image
Normalized TESS light curves. The black and red dots show the light curve with and without rotational variability and trends, respectively. The blue vertical lines mark the start times of flare candidates in Table 3. The de-trended light curve is offset by 0.2 for better visibility. The large rotationally modulated flare, localized at about 81° latitude presented by Ilin et al. (2021a), appears in the second half of the top panel (Sector 12).
Current usage metrics show cumulative count of Article Views (full-text article views including HTML views, PDF and ePub downloads, according to the available data) and Abstracts Views on Vision4Press platform.
Data correspond to usage on the plateform after 2015. The current usage metrics is available 48-96 hours after online publication and is updated daily on week days.
Initial download of the metrics may take a while.