Fig. 7.
Download original image
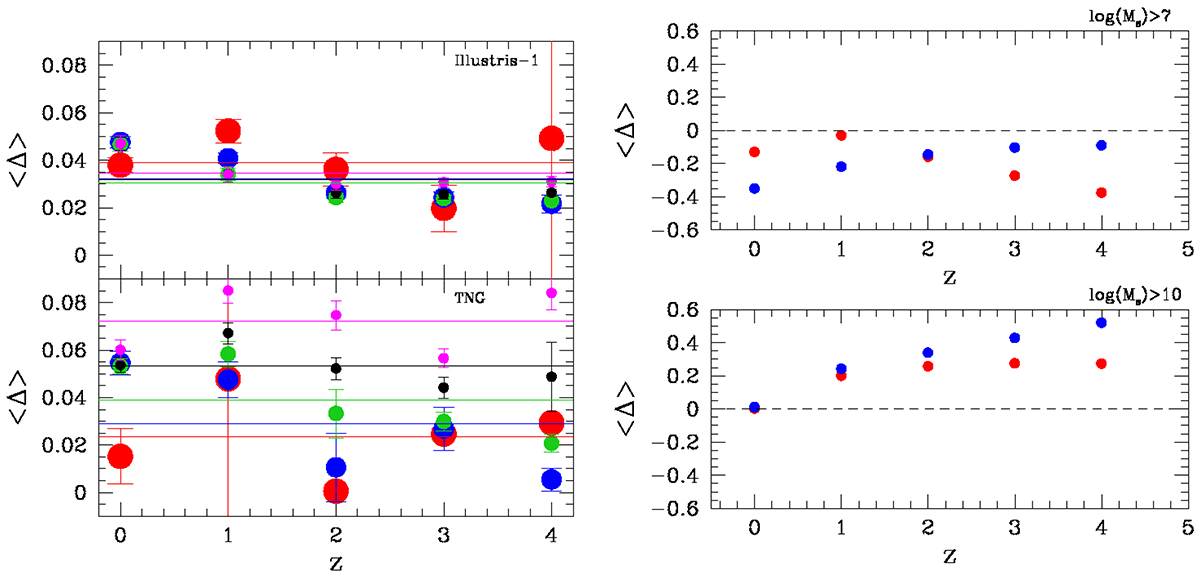
Scatter Δ around the FP for different sources data and different definitios of Δ. Left panel: scatter around the FP for Illutris-1 (upper panel) and IllustrisTNG-100 (lower panel) obtained from simulations. The dots of different colors mark the values of the scatter obtained for different range of masses: red dots (log(Ms/M⊙) > 11), blue dots (log(Ms/M⊙) > 10), green dots (log(Ms/M⊙) > 9), black dots (log(Ms/M⊙) > 8), magenta dots (log(M/ M⊙) > 7). The colored lines give the average scatter across time for each mass sample. The Δ’s are calculated according Eq. (5). Right panel: scatter around the FP for Illustris-1 (red dots) and IllustrisTNG-100 (blue dots) at different redshift. In this case the scatter is obtained from the difference of the measured log(Re) and the value calculated using the expression of the FP with fixed coefficients given by the sample at z = 0 with masses larger than 1010 M⊙. The Δ’s are calculated according Eq. (7). The upper and lower panels show the scatter for the two samples of models with different low mass limit.
Current usage metrics show cumulative count of Article Views (full-text article views including HTML views, PDF and ePub downloads, according to the available data) and Abstracts Views on Vision4Press platform.
Data correspond to usage on the plateform after 2015. The current usage metrics is available 48-96 hours after online publication and is updated daily on week days.
Initial download of the metrics may take a while.