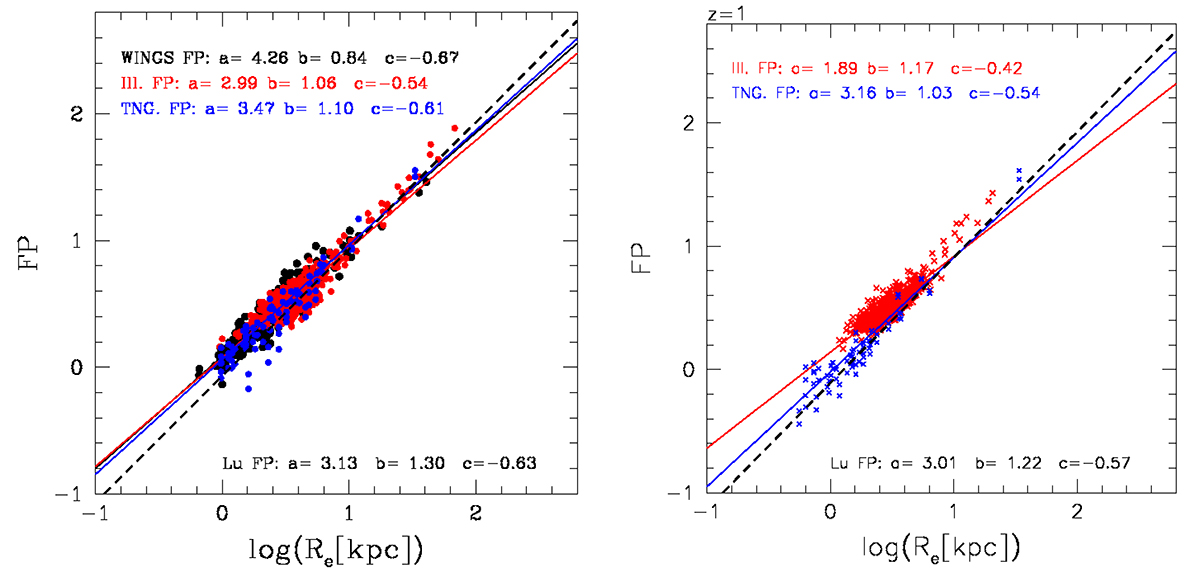
Fig. 6.
Download original image
FP for our data compared with those of Lu et al. (2020). Left panel: FP coefficients obtained at z = 0 for the WINGS and Illustris data fitted in the same mass interval chosen by Lu et al. (2020). The black dots mark the WINGS data, the red ones the Illutris-1 and the blue ones the IllustrisTNG-100 data. The FP coefficients obtained by Lu et al. (2020) are listed at the bottom of the panel and the dashed line visualizes the relation. Right panel: same as in the left panel but for the data and relationsips at z = 1. The dashed line is the FP of Lu et al. (2020) FP whose coefficients are also displayed in the panel for the sake of clarity.
Current usage metrics show cumulative count of Article Views (full-text article views including HTML views, PDF and ePub downloads, according to the available data) and Abstracts Views on Vision4Press platform.
Data correspond to usage on the plateform after 2015. The current usage metrics is available 48-96 hours after online publication and is updated daily on week days.
Initial download of the metrics may take a while.