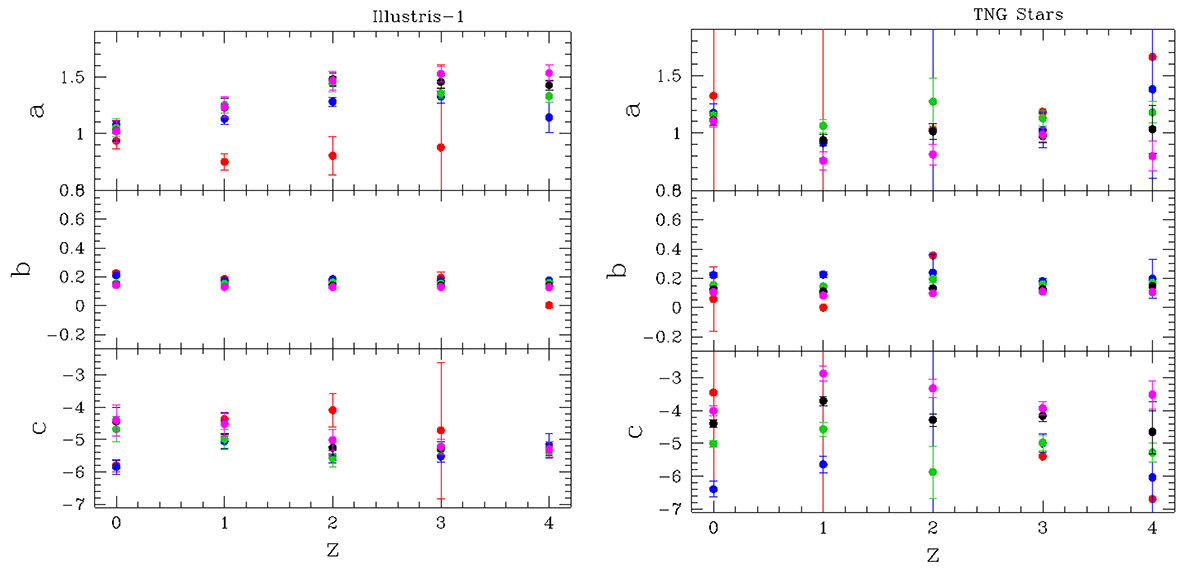
Fig. 5.
Download original image
Coefficients of the FP at different redshift for Illutris-1 (left panel) and IllustrisTNG-100 (right panel). The coefficients are obtained from 500 fits of the FP created with a random sample of 200 galaxies. The color of the dots indicate the values for different range of masses: red dots (log(Ms/M⊙) > 11), blue dots (log(Ms/M⊙) > 10), green dots (log(Ms/M⊙) > 9), black dots (log(Ms/M⊙) > 8), magenta dots (log(Ms/M⊙) > 7).
Current usage metrics show cumulative count of Article Views (full-text article views including HTML views, PDF and ePub downloads, according to the available data) and Abstracts Views on Vision4Press platform.
Data correspond to usage on the plateform after 2015. The current usage metrics is available 48-96 hours after online publication and is updated daily on week days.
Initial download of the metrics may take a while.