Fig. 3.
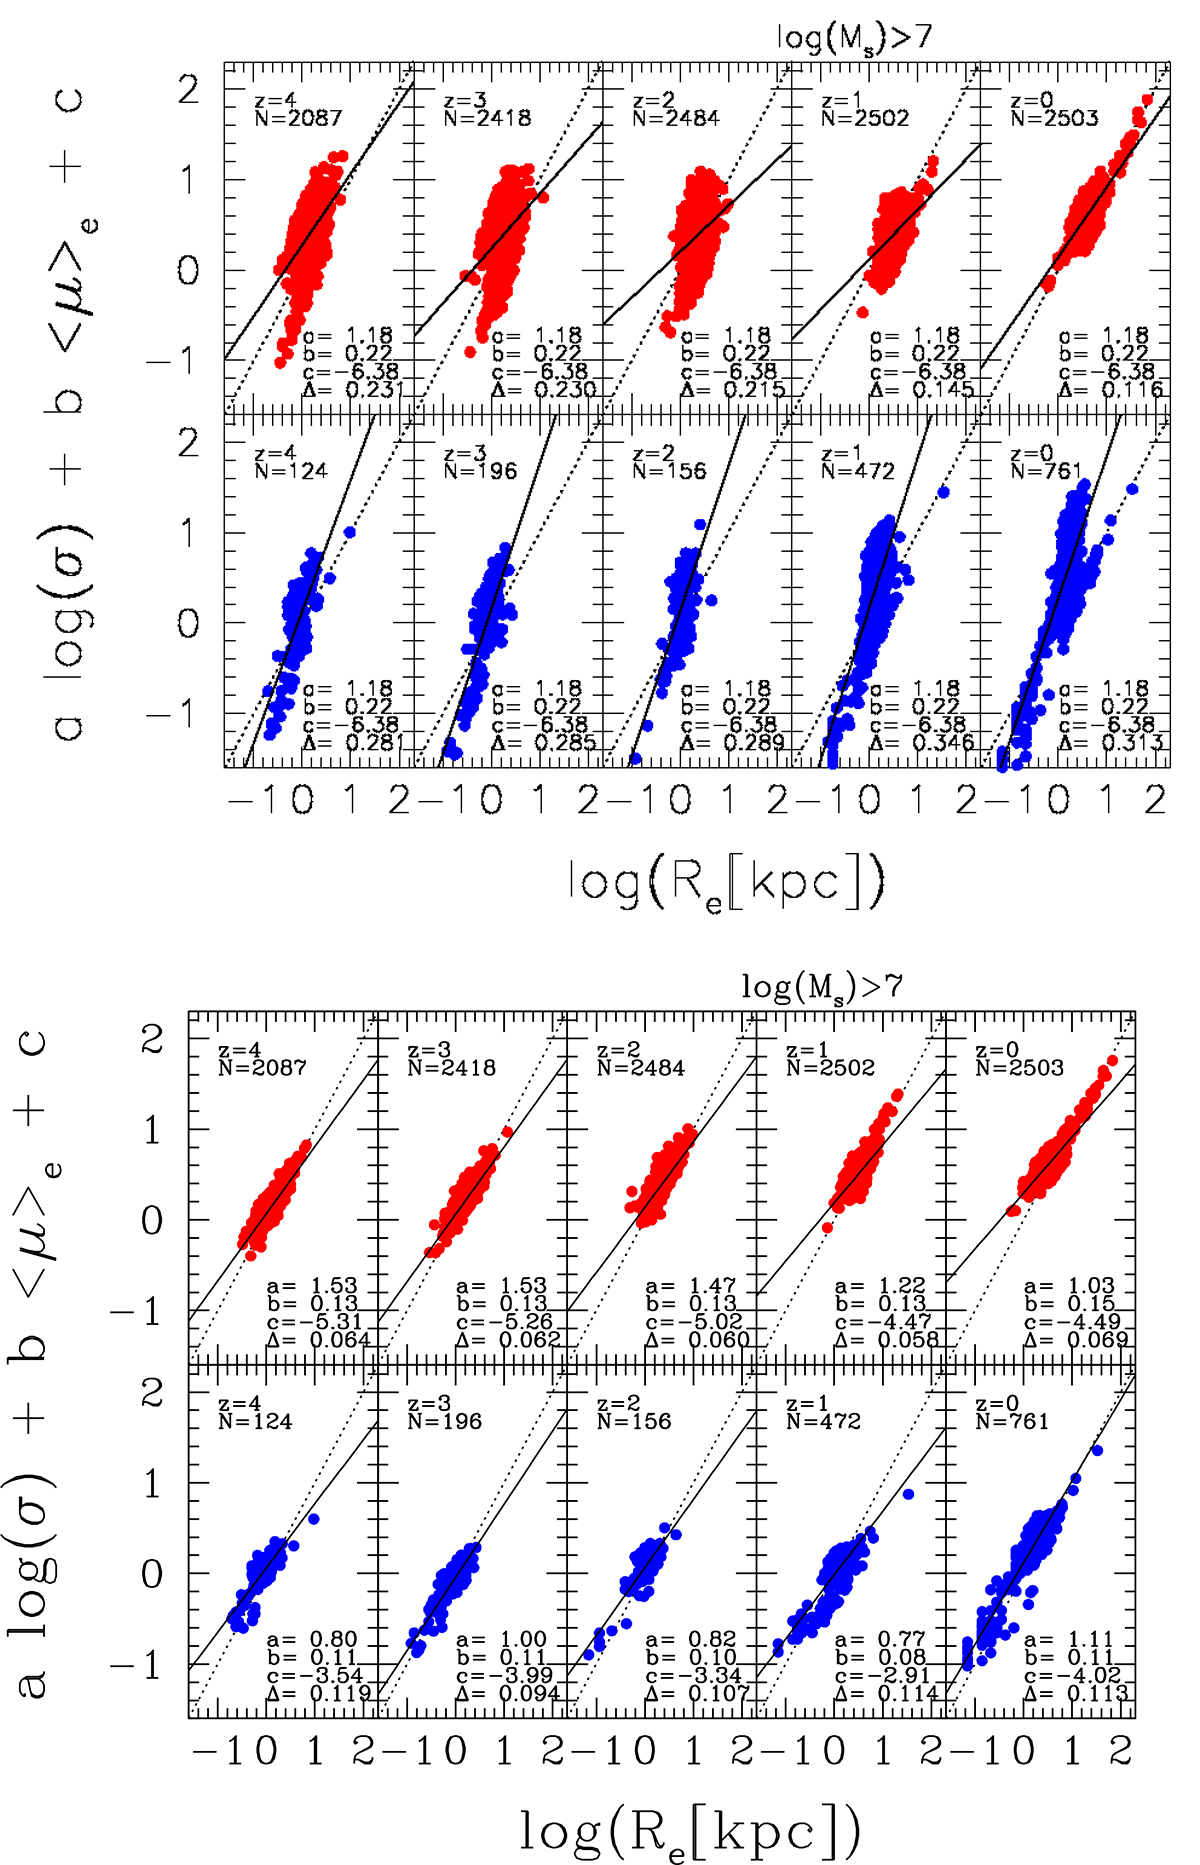
Download original image
Edge-on FP at different redshifts for the Illustris-1 and IllustrisTNG-100 datasets. All panels with red dots are for Illustris-1, and all panels with blue dots are for IllustrisTNG-100. In each panel we show the redshift z, the total number N of galaxies, and the coefficients a, b, c of the FP and the dispersion Δ around it. The low mass limit of the galaxies is log(Ms/M⊙) > 7. The dotted lines mark the one-to-one relations. The black solid line (when present) is the fit of the FP. In the group of panels at the top side, the FP at z = 0 is supposed to hold also at all other redshifts, while in the group of panels at the bottom side the FP varies according to the redshift. See the text for all other details.
Current usage metrics show cumulative count of Article Views (full-text article views including HTML views, PDF and ePub downloads, according to the available data) and Abstracts Views on Vision4Press platform.
Data correspond to usage on the plateform after 2015. The current usage metrics is available 48-96 hours after online publication and is updated daily on week days.
Initial download of the metrics may take a while.