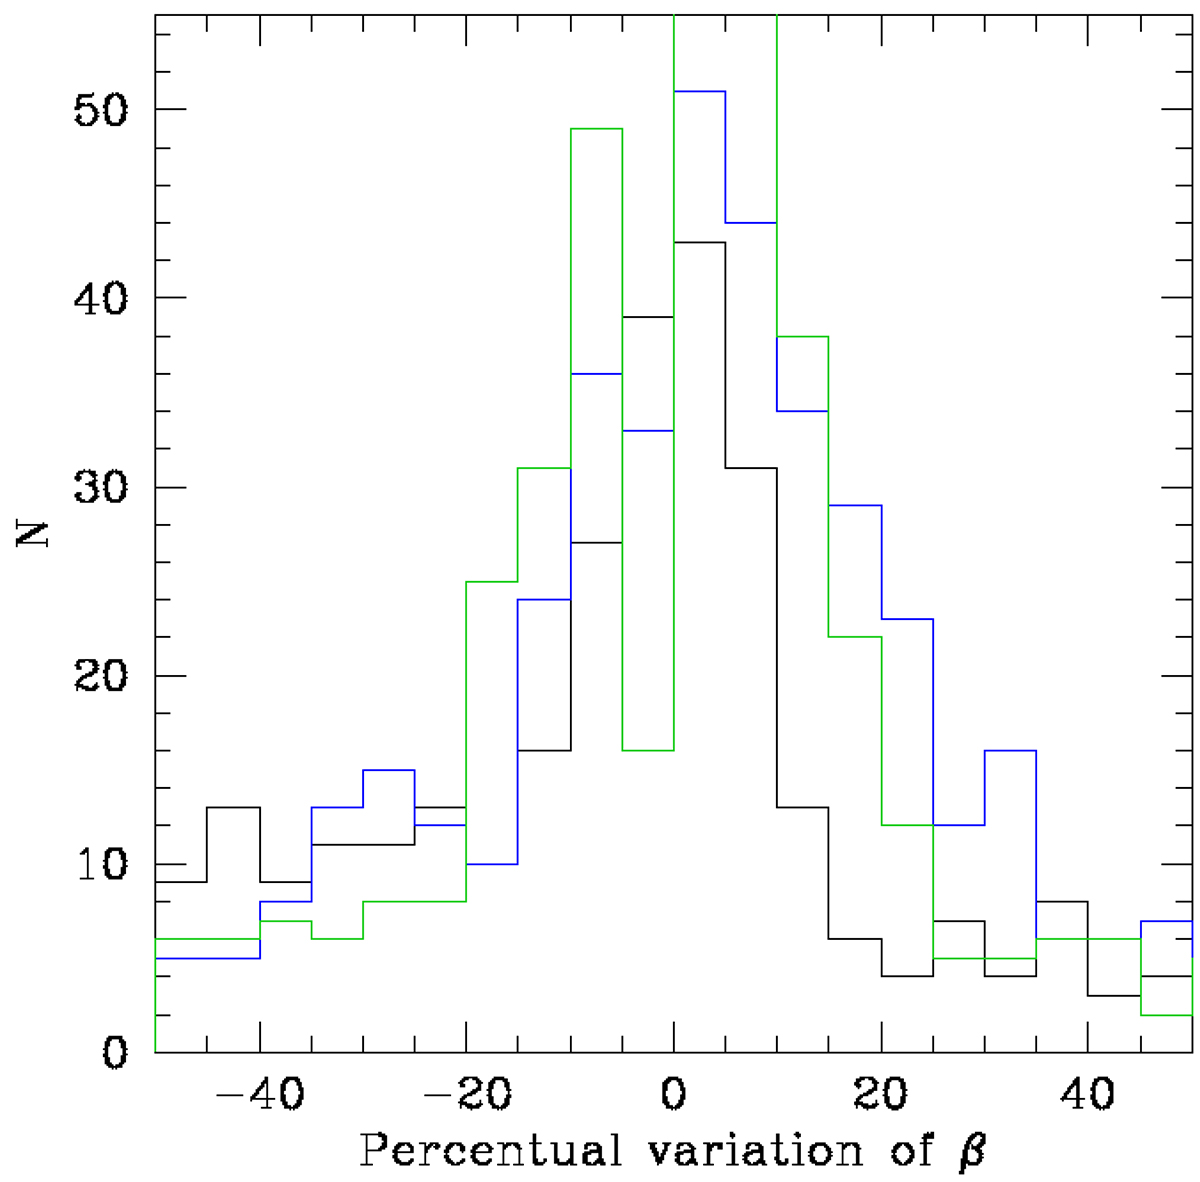
Fig. 22.
Download original image
Percentage change of the β parameter. The black histogram shows the results of our Montecarlo simulations of the errors affecting the observational parameters (Ms, L, Re, σ, Ie and their effects on log ![]() and β). The blue histogram shows the variations with the analytical method and Gaussian random distribution of the uncertainties affecting the characterizing parameters of each galaxy that is described in Appendix B obtained from the calculus of the derivatives. The green histogram shows the results obtained using the analytical method with the flat random distribution of uncertainties (see also Appendix B).
and β). The blue histogram shows the variations with the analytical method and Gaussian random distribution of the uncertainties affecting the characterizing parameters of each galaxy that is described in Appendix B obtained from the calculus of the derivatives. The green histogram shows the results obtained using the analytical method with the flat random distribution of uncertainties (see also Appendix B).
Current usage metrics show cumulative count of Article Views (full-text article views including HTML views, PDF and ePub downloads, according to the available data) and Abstracts Views on Vision4Press platform.
Data correspond to usage on the plateform after 2015. The current usage metrics is available 48-96 hours after online publication and is updated daily on week days.
Initial download of the metrics may take a while.