Fig. 20.
Download original image
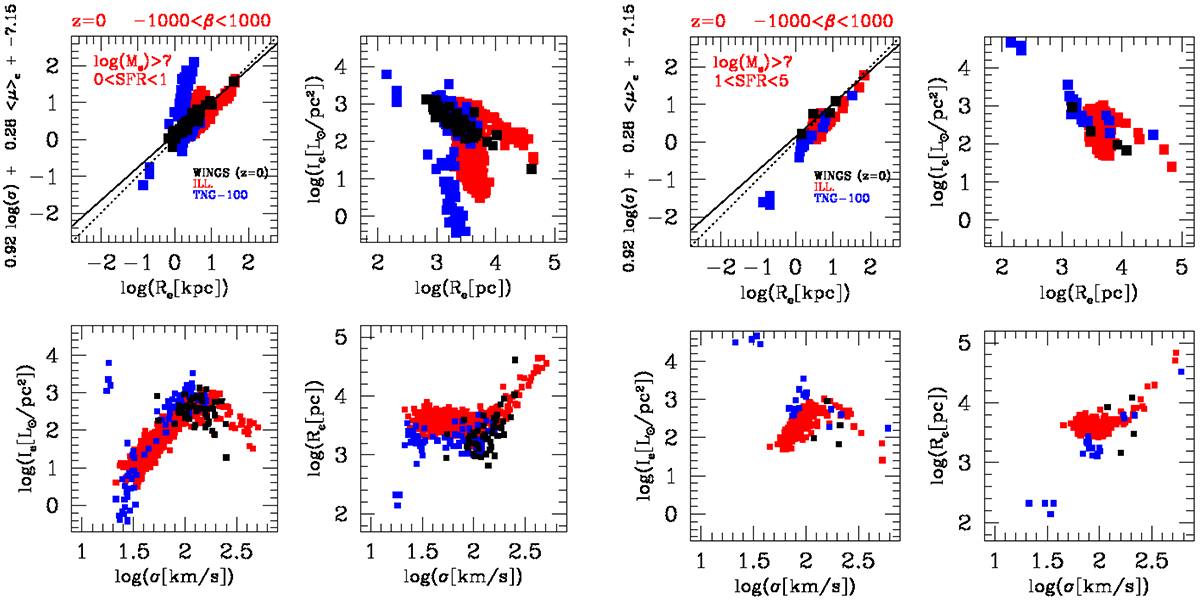
Distribution on the FP and its projection planes of galaxies with different star formation rates (SFR) in units of M⊙ yr−1 and any value of β in the interval −1000 < β < 1000. Two groups of models characterized by different values of SFR are shown. In each group of panels are shown the FP at top left plus three projections planes as indicated. The black points are the WINGS data, the red and blue points the Illustris-1 and IllustrisTNG-100 model galaxies, respectively. The lower mass limit of galaxies is log(Ms/M⊙) = 7). The redshift is z = 0. Left panel: SFR in the range 0 < SFR < 1. Right panel: SFR in the range 1 < SFR < 5.
Current usage metrics show cumulative count of Article Views (full-text article views including HTML views, PDF and ePub downloads, according to the available data) and Abstracts Views on Vision4Press platform.
Data correspond to usage on the plateform after 2015. The current usage metrics is available 48-96 hours after online publication and is updated daily on week days.
Initial download of the metrics may take a while.