Fig. 19.
Download original image
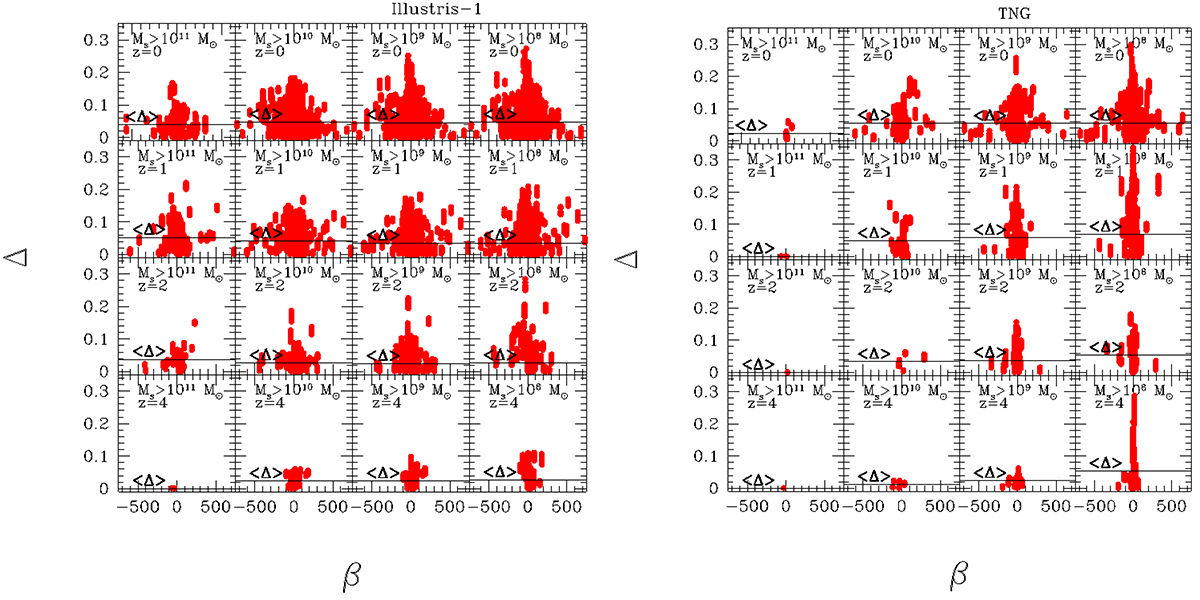
Scatter around the FP as a function of the β parameter for different intervals of mass and at different redshift epochs. Left panel: Illustris-1 data. Right panel: IllustrisTNG-100 data. In the panels the redshft increases from the top to the bottom, while the low mass limit of galaxies decreases from left to right. The red little squares show the scatter around the FP, while the solid lines show the mean value of it.
Current usage metrics show cumulative count of Article Views (full-text article views including HTML views, PDF and ePub downloads, according to the available data) and Abstracts Views on Vision4Press platform.
Data correspond to usage on the plateform after 2015. The current usage metrics is available 48-96 hours after online publication and is updated daily on week days.
Initial download of the metrics may take a while.